
The Parabolic SAR indicator stands for “Stop And Reverse,” a fitting name for a tool that tells you exactly when to exit your current position and potentially enter a new one in the opposite direction. Created by the legendary J. Welles Wilder Jr., the same brilliant mind behind the RSI and ATR indicators, the Parabolic SAR addresses one of the most challenging aspects of forex trading: knowing when to get out. Unlike complex oscillators or confusing chart patterns, this indicator provides crystal-clear visual signals that even novice traders can interpret with confidence.
What makes the Parabolic SAR indicator particularly valuable for forex traders is its dual functionality. Not only does it identify trend direction with remarkable accuracy, but it also provides dynamic stop-loss levels that automatically adjust as trends develop. This unique combination makes it an indispensable tool for anyone serious about consistent profitability in the currency markets. Whether you’re a scalper looking for quick profits or a swing trader riding longer-term trends, mastering the Parabolic SAR can transform your trading results.
Understanding the Parabolic SAR Basics
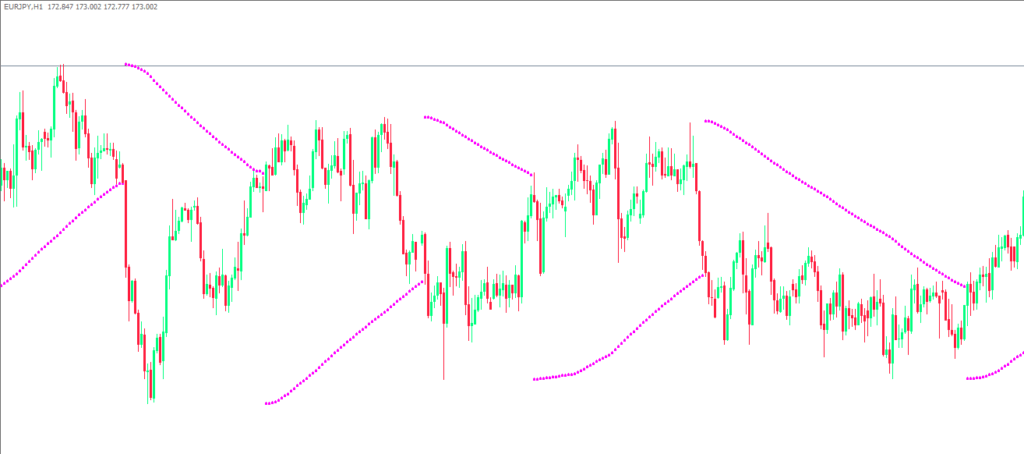
The Parabolic SAR indicator appears on your forex charts as a series of dots positioned either above or below the price action. These dots aren’t randomly placed; they represent calculated levels based on the relationship between price movement and time. When you see dots below the candlesticks, the indicator is signaling a bullish trend, suggesting that buyers are in control and prices are likely to continue rising. Conversely, dots above the price action indicate a bearish trend, warning that sellers dominate the market.
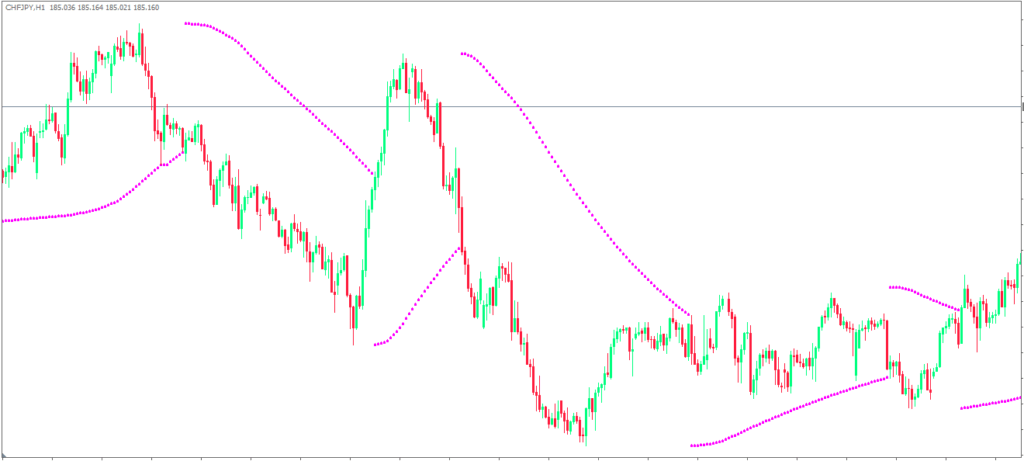
The genius of the Parabolic SAR lies in its adaptive nature. As trends strengthen and accelerate, the dots move closer to the price action, creating a tightening protective barrier that locks in more profits while still giving the trend room to breathe. This acceleration feature sets it apart from traditional moving averages or static support and resistance levels. The indicator essentially learns from the market’s behavior, becoming more aggressive in strong trends and more conservative when momentum begins to fade.
What truly distinguishes the Parabolic SAR from other technical indicators is its binary nature. There’s no ambiguity or subjective interpretation required. Either the dots are below the price and you’re looking for buying opportunities, or they’re above the price and you’re considering short positions. This clarity makes it particularly valuable for forex traders who need to make quick decisions in fast-moving markets like EUR/USD or GBP/JPY.
The indicator’s creator, J. Welles Wilder Jr., designed it specifically to solve the age-old trading dilemma of when to exit profitable positions. Too often, traders watch winning trades turn into losers because they held on too long, hoping for even greater profits. The Parabolic SAR eliminates this emotional decision-making by providing objective, mathematically-based exit levels that adjust automatically as market conditions change.
The Math Behind Parabolic SAR Calculations
While you don’t need to be a mathematician to use the Parabolic SAR effectively, understanding its underlying calculations can significantly improve your trading results. The indicator uses a formula that combines time and price acceleration to determine where each dot should be placed. The key component is the Acceleration Factor, commonly abbreviated as AF, which starts at 0.02 and increases by 0.02 each time the price makes a new high in an uptrend or a new low in a downtrend.
The default settings for most trading platforms set the initial acceleration factor at 0.02 and cap the maximum at 0.20. This means that in a strong trending market, the SAR dots will accelerate toward the price action, creating an increasingly steep trajectory that reflects the momentum of the move. For example, if EUR/USD is in a strong uptrend and continues making new highs, the SAR dots below the price will climb more aggressively with each new high, eventually reaching the maximum acceleration factor of 0.20.
This acceleration mechanism is what gives the Parabolic SAR its unique ability to adapt to different market conditions. In the early stages of a trend, when the acceleration factor is still low, the dots remain relatively far from the price action, giving the trend plenty of room to develop. As the trend matures and proves its strength through continued new highs or lows, the indicator becomes more aggressive, moving closer to protect accumulated profits.
The mathematical beauty of the Parabolic SAR becomes most apparent during trend reversals. When the price finally touches or crosses through the SAR dots, the entire calculation resets. The acceleration factor returns to its initial 0.02 value, and the dots flip to the opposite side of the price action. This “stop and reverse” mechanism ensures that traders are always positioned with the prevailing trend, eliminating the guesswork that plagues many other trading approaches.
Interpreting Parabolic SAR Trading Signals
Reading Parabolic SAR signals is refreshingly straightforward compared to many other technical indicators. When the dots appear below the price candles, the indicator is generating bullish signals, suggesting that the current trend is upward and traders should be looking for buying opportunities. This configuration is particularly powerful when it coincides with other bullish factors such as breaking above key resistance levels or positive fundamental news affecting the currency pair.
The strength of bullish SAR signals can be gauged by observing how the dots behave as the trend develops. In strong uptrends, you’ll notice the dots climbing steadily beneath the price action, often accelerating their ascent as new highs are reached. This acceleration pattern indicates increasing momentum and suggests that the upward trend is gaining strength rather than weakening. Professional forex traders often use this acceleration as confirmation that a trend is likely to continue, making it an excellent time to add to existing long positions.
Bearish signals occur when the dots position themselves above the price action, indicating that sellers are in control and the trend is moving downward. Just as with bullish signals, the behavior of the dots provides valuable information about trend strength. When SAR dots above the price begin accelerating downward following new lows, it suggests that selling pressure is intensifying and the downward trend is likely to persist.
The most critical signals generated by the Parabolic SAR occur during trend reversals, when the dots switch from one side of the price action to the other. These “flip” moments represent the indicator’s stop and reverse mechanism in action, suggesting that the previous trend has ended and a new trend in the opposite direction may be beginning. However, experienced traders understand that not every SAR flip represents a significant trend change, particularly in choppy or sideways markets where false signals are common.
Timing is crucial when interpreting SAR reversal signals. The most reliable reversals typically occur after extended trends when the acceleration factor has reached or approached its maximum value. These situations suggest that the previous trend had significant momentum before reversing, increasing the probability that the new trend will also develop meaningful follow-through.
Proven Parabolic SAR Trading Techniques
The trend following strategy represents the most straightforward application of the Parabolic SAR indicator in forex trading. This approach involves entering long positions when the SAR dots flip from above to below the price action, and entering short positions when the opposite occurs. The beauty of this strategy lies in its systematic nature, eliminating emotional decision-making and providing clear entry and exit criteria.
For trend following with the Parabolic SAR, successful traders typically wait for confirmation that a new trend is establishing itself rather than jumping on every reversal signal. This might involve waiting for the price to move a certain distance away from the reversal point, or requiring that the new trend hold for a specific number of candles before entering. Such filters help avoid the whipsaw losses that can occur during periods of market indecision.
Combining the Parabolic SAR with moving averages creates a powerful trend-following system that many professional traders rely on. A popular approach involves using the SAR for precise entry and exit timing while employing longer-term moving averages like the 50 or 200-period EMA to determine overall trend direction. Trades are only taken when both indicators align, with the SAR providing bullish signals while the price remains above the moving average for long trades, or bearish signals while price stays below the moving average for short trades.
The SAR-moving average combination proves particularly effective in strongly trending markets like those often seen in major currency pairs during significant economic events or central bank announcements. When EUR/USD is trending strongly upward and trading well above its 200-period moving average, SAR pullback signals can provide excellent low-risk entry opportunities for traders looking to join the established trend.
Breakout trading with the Parabolic SAR offers another sophisticated approach that many experienced forex traders employ. This strategy involves identifying key support or resistance levels and waiting for price to break through these levels with SAR confirmation. When a currency pair breaks above significant resistance with SAR dots positioned below the price action, it often signals the beginning of a strong upward move that can provide substantial profits.
The scalping applications of the Parabolic SAR deserve special attention given the popularity of short-term trading in forex markets. On shorter timeframes like 5-minute or 15-minute charts, the SAR can provide rapid-fire signals that scalpers use to capture quick profits from minor price movements. However, scalping with the SAR requires careful attention to spread costs and requires brokers with tight spreads to remain profitable after transaction costs.
Optimal Parabolic SAR Settings for Different Markets
The default Parabolic SAR settings of 0.02 for the initial acceleration factor and 0.20 for the maximum work reasonably well across most forex pairs and timeframes, but understanding how to adjust these parameters can significantly improve your trading results. These standard settings were designed for daily charts and may not be optimal for the various timeframes and volatility levels commonly encountered in forex trading.
For highly volatile currency pairs like GBP/JPY or AUD/JPY, many traders find that reducing the acceleration factors to 0.01 initial and 0.15 maximum helps reduce false signals caused by erratic price movements. These more conservative settings keep the SAR dots further from the price action, providing more breathing room for the natural volatility of these pairs while still capturing significant trend changes.
Conversely, when trading less volatile major pairs like EUR/USD or USD/CHF during quiet market periods, slightly more aggressive settings such as 0.03 initial and 0.25 maximum can help capture smaller moves that might not trigger signals with default settings. The key is matching the indicator’s sensitivity to the natural volatility and behavior patterns of your chosen currency pairs.
Timeframe considerations play a crucial role in SAR optimization. Shorter timeframes like 1-minute or 5-minute charts often benefit from more conservative settings to avoid excessive signal generation, while longer timeframes like 4-hour or daily charts can handle more aggressive parameters. Many successful day traders use 0.015 initial and 0.18 maximum settings on 15-minute charts, finding this combination provides a good balance between signal frequency and accuracy.
The market environment also influences optimal SAR settings. During strong trending periods, such as those following major economic announcements or geopolitical events, more aggressive settings can help capture more of the price movement. However, during consolidation periods or uncertain market conditions, conservative settings help avoid the numerous false signals that can plague trend-following systems.
Parabolic SAR Advantages and Limitations
The visual clarity of the Parabolic SAR represents one of its greatest strengths for forex traders. Unlike complex oscillators that require interpretation of multiple lines or levels, the SAR provides unmistakable signals through its simple dot placement system. This clarity makes it accessible to traders at all experience levels while remaining sophisticated enough for professional use.
The automatic stop-loss feature built into the Parabolic SAR eliminates one of the most challenging aspects of forex trading: determining where to place protective stops. Each SAR dot represents a logical stop-loss level that adjusts automatically as trends develop. This dynamic stop-loss system helps traders stay in winning trades longer while protecting against major losses when trends reverse.
The indicator’s performance in trending markets is exceptional, often capturing the majority of significant price movements while providing timely exit signals. During strong trends in major currency pairs, the Parabolic SAR can help traders ride moves for hundreds of pips while maintaining reasonable risk control through its trailing stop mechanism.
However, the Parabolic SAR struggles significantly in sideways or choppy market conditions. During periods of consolidation, the indicator generates frequent false signals as price repeatedly crosses back and forth through the SAR dots. These whipsaw conditions can quickly erode trading capital if traders don’t recognize them and adjust their approach accordingly.
The lagging nature of the Parabolic SAR, while less pronounced than many other trend-following indicators, still means that traders will miss the very beginning and end of trends. The mathematical requirement for price to actually touch the SAR dots before generating reversal signals ensures that some profit will be left on the table during trend changes.
Range-bound market conditions represent the Achilles’ heel of the Parabolic SAR. When currency pairs trade within established ranges for extended periods, the indicator becomes virtually unusable as a standalone tool. Recognizing these market conditions and either avoiding SAR signals or combining them with range-trading techniques becomes essential for maintaining profitability.
Avoiding Common Parabolic SAR Trading Errors
The most costly mistake traders make with the Parabolic SAR involves continuing to use it during clearly choppy or sideways market conditions. Many novice traders, attracted by the indicator’s simplicity, fail to recognize when market conditions aren’t suitable for trend-following approaches. Learning to identify consolidation periods and either stepping aside or switching to range-trading strategies can save significant capital.
Ignoring the overall trend direction when interpreting SAR signals represents another common error that can prove expensive. Just because the SAR dots flip to the bullish side doesn’t necessarily mean it’s time to buy if the overall trend remains bearish. Professional traders always consider multiple timeframe analysis, using longer-term charts to determine the prevailing trend before acting on shorter-term SAR signals.
Using default settings across all currency pairs and market conditions without consideration for their unique characteristics leads to suboptimal results. Each forex pair has its own volatility profile and trending characteristics, and successful SAR trading requires adjusting the indicator’s parameters to match these individual traits.
The failure to combine the Parabolic SAR with other forms of analysis represents a significant limitation in many traders’ approaches. While the SAR excels at trend identification and timing, it provides no information about momentum, overbought or oversold conditions, or fundamental factors that might affect currency values. Integrating complementary indicators or analysis techniques significantly improves overall trading performance.
Poor risk management when trading SAR signals can quickly destroy trading accounts even when the signals themselves are accurate. Some traders mistakenly believe that because the SAR provides automatic stop-loss levels, they don’t need to consider position sizing or overall risk management principles. Proper position sizing based on account equity and risk tolerance remains crucial regardless of the indicators being used.
Start Mastering Parabolic SAR Today
The Parabolic SAR indicator offers forex traders a uniquely powerful combination of trend identification and risk management in a single, easy-to-interpret tool. Its visual clarity and automatic stop-loss features make it accessible to beginners while its mathematical sophistication ensures it remains valuable for professional traders. The key to success lies in understanding both its strengths in trending markets and its limitations during consolidation periods.
Remember that mastering any trading tool requires practice and patience. Start by observing how the Parabolic SAR behaves across different currency pairs and timeframes without risking real money. Use demo accounts to experiment with different settings and combinations with other indicators until you develop a feel for how the SAR responds to various market conditions.
The most successful SAR traders don’t rely on the indicator in isolation but rather integrate it into comprehensive trading systems that account for multiple timeframe analysis, fundamental factors, and proper risk management principles. Take the time to develop your own systematic approach that incorporates the SAR’s signals while addressing its limitations through complementary analysis techniques.
Your journey to profitable forex trading doesn’t have to be complicated. The Parabolic SAR provides a solid foundation upon which to build successful trading strategies. Start implementing these concepts gradually, focus on consistency over complexity, and always prioritize risk management over profit maximization. With dedication and proper application, the Parabolic SAR can become one of your most valuable trading tools.
Frequently Asked Questions About Parabolic SAR Indicator
What’s the difference between Parabolic SAR and moving averages for forex trading?
The Parabolic SAR accelerates toward price action as trends strengthen, while moving averages maintain relatively constant distances from price. This acceleration feature makes SAR more responsive to momentum changes and provides tighter stop-losses in strong trends. However, moving averages tend to be more stable during choppy market conditions, while SAR generates more false signals during consolidation periods.
Can I use Parabolic SAR for scalping on very short timeframes?
Yes, many scalpers successfully use Parabolic SAR on 1-minute to 15-minute charts, but it requires careful optimization of settings and attention to spread costs. Consider using more conservative acceleration factors (0.01-0.15) on shorter timeframes to reduce false signals. Always ensure your broker offers tight spreads, as frequent SAR signals combined with wide spreads can quickly erode profits in scalping strategies.
How do I know when NOT to trade Parabolic SAR signals?
Avoid trading SAR signals during obvious sideways market conditions, low-volume periods, or when major economic news is pending. If you notice frequent SAR flips with minimal price movement, or if the dots are switching sides every few candles, the market is likely choppy and unsuitable for trend-following strategies. Wait for clear directional moves before resuming SAR-based trading.
Should I always use the default SAR settings (0.02, 0.20) for all currency pairs?
No, different currency pairs have varying volatility characteristics that benefit from customized settings. Highly volatile pairs like GBP/JPY often work better with more conservative settings (0.01, 0.15), while less volatile pairs like EUR/CHF might benefit from slightly more aggressive settings (0.025, 0.22). Test different parameters on historical data to find optimal settings for your preferred currency pairs.
How can I reduce false signals when using Parabolic SAR?
Combine SAR with trend-confirming indicators like moving averages or ADX to filter signals. Only take bullish SAR signals when price is above key moving averages, and bearish signals when below. Additionally, wait for confirmation candles after SAR flips, require minimum pip movements from reversal points, and avoid trading during low-volatility periods when false signals are more common.