The Average True Range indicator, commonly known as ATR, serves as your market volatility compass, helping you navigate the often turbulent waters of forex trading. Unlike traditional indicators that focus on price direction, ATR measures the degree of price movement, giving you invaluable insights into market behavior that can transform your trading approach. Whether you’re a scalper dealing with minute-by-minute fluctuations or a swing trader holding positions for days, understanding ATR can be the difference between consistent profits and devastating losses.
In today’s fast-paced forex environment, where market conditions can shift from calm to chaotic within minutes, having a reliable method to gauge volatility isn’t just helpful—it’s essential for survival. The ATR indicator provides exactly this capability, offering a quantitative approach to what many traders try to assess through gut feeling alone.
Understanding the Average True Range: Your Volatility Decoder
The Average True Range indicator was developed by renowned technical analyst J. Welles Wilder Jr. in 1978, the same brilliant mind behind the Relative Strength Index (RSI). While RSI measures momentum, ATR focuses exclusively on volatility, making it an indispensable tool for risk management and position sizing in forex trading.
At its core, ATR measures the average range of price movement over a specified period, typically 14 periods. But here’s where it gets interesting for forex traders: ATR doesn’t just look at the simple high-low range of each period. Instead, it calculates the “true range,” which accounts for gaps and considers the relationship between the current period and the previous period’s closing price.
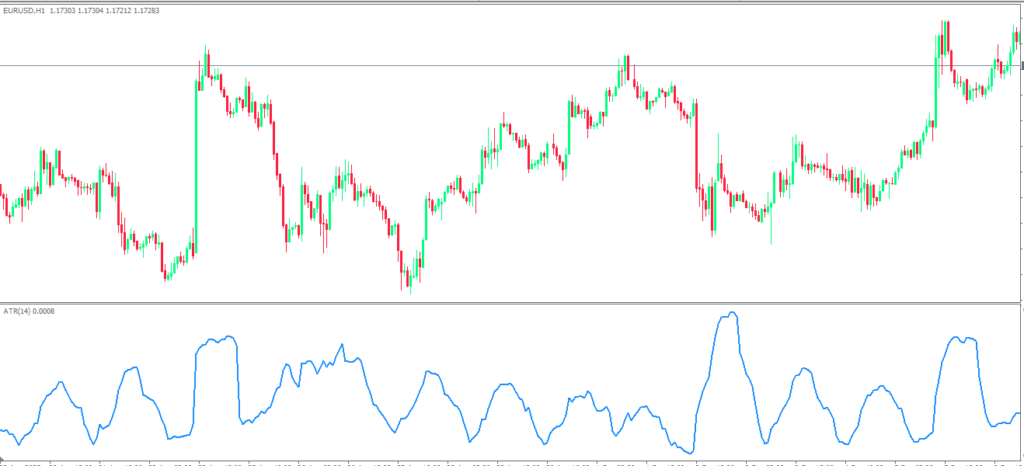
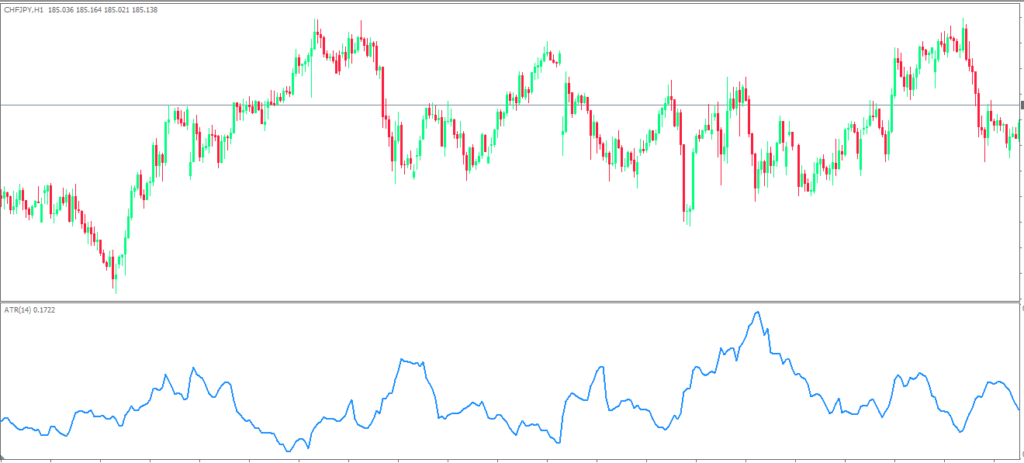
Think of ATR as a sophisticated volatility thermometer. When ATR readings are high, the market is experiencing significant price swings—imagine trading EUR/USD during major ECB announcements where 100-pip moves happen in minutes. Conversely, low ATR readings indicate a quieter market, perhaps like the Asian session on a typical Tuesday when major currency pairs barely move 20 pips all day.
The beauty of ATR lies in its universal application across different timeframes and currency pairs. Whether you’re analyzing the volatile GBP/JPY on a 5-minute chart or the steady USD/CHF on a daily timeframe, ATR provides consistent, comparable volatility measurements that help inform your trading decisions.
ATR Calculation Made Simple: Breaking Down the Numbers
While the mathematical formula behind ATR might seem intimidating at first glance, understanding the calculation process will give you deeper insights into how this powerful indicator works. The true range calculation considers three possible scenarios for each trading period, always selecting the largest value to ensure accuracy.
The true range for any given period is the maximum of three calculations: the difference between the current high and low, the absolute value of the current high minus the previous close, or the absolute value of the current low minus the previous close. This approach ensures that overnight gaps or significant price movements between periods are properly accounted for in the volatility measurement.
Let’s walk through a practical example using EUR/USD. Suppose yesterday’s closing price was 1.1050, and today’s high is 1.1080 while the low is 1.1030. The true range would be the largest of these three values: today’s high-low range (50 pips), the gap from yesterday’s close to today’s high (30 pips), or the gap from yesterday’s close to today’s low (20 pips). In this case, the true range would be 50 pips.
The Average True Range is then calculated by taking a moving average of these true range values over your chosen period. The standard setting is 14 periods, which Wilder found to provide an optimal balance between responsiveness and smoothness. This means your ATR value represents the average volatility over the last 14 trading periods, giving you a reliable baseline for current market conditions.
Understanding this calculation process helps explain why ATR is such a robust volatility measure. By considering gaps and inter-period relationships, ATR provides a more comprehensive picture of market volatility than simple range calculations, making it particularly valuable for forex traders who deal with markets that can gap significantly between sessions.
Interpreting ATR Values: Reading the Market’s Pulse
Successfully interpreting ATR values is where the rubber meets the road in practical forex trading. Unlike oscillators that move between fixed boundaries, ATR values are absolute and specific to each currency pair and timeframe, making proper interpretation crucial for effective implementation.
High ATR readings signal increased market volatility, often coinciding with major news events, economic releases, or shifts in market sentiment. For instance, when the Federal Reserve announces unexpected policy changes, you’ll typically see ATR values spike across USD pairs as traders react to new information. These high volatility periods present both opportunities for larger profits and increased risks that require careful position sizing.
Conversely, low ATR readings indicate market consolidation or reduced volatility. These periods often occur during holidays, between major trading sessions, or when markets are awaiting significant announcements. While low volatility might seem boring, experienced forex traders know these periods often precede major breakouts, making ATR an excellent tool for anticipating market expansion.
The key to successful ATR interpretation lies in understanding relative values rather than absolute numbers. An ATR reading of 80 pips might be normal for GBP/JPY but extremely high for EUR/CHF. This is why many professional traders use ATR percentages or compare current ATR values to historical averages for the same currency pair and timeframe.
Context is everything when interpreting ATR values. A rising ATR during an uptrend might signal trend acceleration, while increasing ATR during sideways movement could indicate an impending breakout. Similarly, declining ATR values toward the end of a strong trend might suggest trend exhaustion and potential reversal opportunities.
Top ATR Trading Strategies: Practical Applications for Forex Success
The real power of ATR reveals itself through practical application in your trading strategies. Rather than being a directional indicator, ATR serves as a risk management and trade optimization tool that can significantly improve your forex trading results when properly implemented.
Stop Loss Placement Using ATR
One of the most valuable applications of ATR in forex trading is dynamic stop loss placement. Traditional fixed stop losses often fail because they don’t account for varying market conditions. ATR-based stop losses adapt to current volatility, giving your trades room to breathe during high volatility periods while tightening during quiet markets.
The standard approach involves placing your stop loss at a multiple of the current ATR value away from your entry price. For example, if EUR/USD has an ATR of 60 pips and you’re going long, you might place your stop loss at 1.5 times ATR (90 pips) below your entry. This approach ensures your stop loss accounts for normal market noise while still protecting your capital from significant adverse moves.
Professional traders often adjust their ATR multipliers based on their trading style and market conditions. Scalpers might use 1-2 times ATR for tight stops, while swing traders might use 2-3 times ATR to avoid premature stop-outs. The key is finding the right balance between giving your trades room to work and maintaining proper risk control.
Position Sizing with ATR Precision
ATR-based position sizing represents a quantum leap in risk management sophistication. Instead of risking the same dollar amount or percentage on every trade, ATR-based position sizing adjusts your trade size based on current market volatility, ensuring consistent risk across varying market conditions.
The calculation involves determining your maximum acceptable loss per trade, then dividing that amount by your ATR-based stop loss distance. For example, if you’re willing to risk $500 per trade and your ATR-based stop loss is 100 pips away, you would size your position to lose $5 per pip, or 1 standard lot for most major pairs.
This approach automatically reduces your position size during high volatility periods when stops must be wider, while increasing position size during low volatility when stops can be tighter. The result is consistent risk management that adapts to market conditions rather than fighting against them.
Market Entry Timing and ATR Confirmation
ATR can also enhance your entry timing by helping identify optimal market conditions for your trading strategy. Many successful forex traders use ATR expansion and contraction patterns to time their entries more effectively.
During periods of extremely low ATR, markets often consolidate before making significant moves. Experienced traders watch for ATR to start expanding from these low levels as confirmation that a new trend or major move is beginning. This technique is particularly effective when combined with other technical analysis tools like support and resistance levels or chart patterns.
Conversely, when ATR reaches extreme highs, it often signals that the current move is overextended and due for a pullback or reversal. This information can help you avoid entering trades at poor timing or even identify counter-trend opportunities for experienced traders.
ATR Limitations and Considerations: What Every Trader Must Know
While ATR is an incredibly valuable tool, understanding its limitations is crucial for proper implementation in your forex trading strategy. Like all technical indicators, ATR has specific characteristics that can sometimes work against traders who don’t fully understand how it functions.
The most significant limitation of ATR is its lagging nature. Since ATR is calculated using historical price data, it always reflects past volatility rather than predicting future volatility. During rapidly changing market conditions, ATR might not immediately reflect the new volatility regime, potentially leading to outdated stop loss levels or position sizing decisions.
This lag becomes particularly problematic during sudden market shocks or major news events. When unexpected announcements cause immediate volatility spikes, your ATR-based stops might not provide adequate protection because they’re based on pre-event volatility levels. Successful ATR users learn to adjust their approach during high-impact news periods or major market events.
Another consideration is that ATR measures volatility without regard to direction. A currency pair experiencing a smooth, steady trend will show lower ATR values than one chopping back and forth within a range, even though the trending pair might actually represent a better trading opportunity. This is why ATR works best when combined with directional indicators or trend analysis tools.
Market structure changes can also affect ATR effectiveness. During market transitions, such as shifts from trending to ranging conditions or changes in overall market volatility regimes, ATR values might not immediately adapt, leading to potentially inappropriate stop loss levels or position sizing decisions.
Quick ATR Setup Guide: Getting Started Today
Implementing ATR in your forex trading platform is straightforward, but proper setup ensures you get maximum benefit from this powerful volatility tool. Most major trading platforms, including MetaTrader 4, MetaTrader 5, and TradingView, include ATR as a standard indicator with customizable settings.
The default 14-period setting works well for most forex trading applications, representing two weeks of trading data on daily charts or roughly three hours on 15-minute charts. However, you should consider adjusting the period based on your trading timeframe and style. Shorter-term traders might prefer 7-10 periods for more responsive readings, while longer-term position traders might use 21-28 periods for smoother, more stable values.
When adding ATR to your charts, consider displaying it in a separate window below your price chart rather than as an overlay. This presentation makes it easier to track ATR trends and compare current readings to historical values. Many traders also add horizontal lines at significant ATR levels to quickly identify when volatility reaches extreme readings.
Color coding your ATR display can provide immediate visual feedback about volatility conditions. You might use green for rising ATR values, red for falling values, and different intensities to represent extreme readings. This visual approach helps you quickly assess market conditions without examining specific numbers.
Remember that ATR values are currency pair and timeframe specific, so you’ll need to develop familiarity with normal ranges for your preferred trading instruments. Keep notes on typical ATR ranges for your main currency pairs during different market conditions to build this expertise over time.
Mastering ATR for Consistent Forex Success
The Average True Range indicator represents one of the most practical and immediately applicable tools in technical analysis, particularly for forex traders who must navigate constantly changing volatility conditions. Unlike complex indicators that attempt to predict market direction, ATR focuses on the measurable reality of price movement, providing concrete data you can use to improve your risk management and trade optimization.
The key to ATR success lies in understanding that it’s not a magic bullet for predicting market movements, but rather a sophisticated tool for adapting your trading approach to current market conditions. By incorporating ATR into your stop loss placement, position sizing, and market timing decisions, you transform from a trader who fights market volatility into one who works with it.
As you begin implementing ATR in your forex trading, start with the basic applications—ATR-based stop losses and position sizing—before moving to more advanced techniques. Like any trading tool, ATR requires practice and experience to master, but the effort invested will pay dividends in improved risk management and more consistent trading results.
The forex market will continue evolving, with new challenges and opportunities emerging regularly. However, the fundamental need to understand and adapt to market volatility will remain constant. The Average True Range indicator provides you with the quantitative foundation to meet this challenge, transforming market volatility from an adversary into a valuable source of trading intelligence.
Take action today by adding ATR to your trading platform and beginning to track volatility patterns in your preferred currency pairs. Start with paper trading or small position sizes as you develop confidence in ATR-based decision making. Your future trading success depends on your ability to adapt to market conditions, and ATR provides the roadmap for that adaptation.
Frequently Asked Questions About Average True Range Indicator
What is the best ATR setting for forex day trading?
For forex day trading, most professionals use a 14-period ATR setting on their primary trading timeframe. However, some day traders prefer slightly shorter periods like 10-12 for more responsive readings, especially when trading highly volatile pairs like GBP/JPY. The key is maintaining consistency once you find a setting that works with your trading style.
How do you calculate position size using ATR?
To calculate position size using ATR, first determine your maximum risk per trade in dollars. Then divide this amount by your ATR-based stop loss distance in pips, converted to dollars per pip. For example, if you risk $200 per trade and your ATR stop is 50 pips away, your position size would be $200 ÷ $5 (assuming $1 per pip) = 2 mini lots.
Can ATR predict market direction or only volatility?
ATR only measures volatility and cannot predict market direction. It tells you how much a currency pair typically moves but not which direction it will move. This is why ATR works best when combined with directional indicators or trend analysis tools for complete market analysis.
What ATR value indicates high volatility in major forex pairs?
High volatility ATR values vary significantly between currency pairs. For EUR/USD, readings above 100 pips often indicate high volatility, while GBP/JPY might need ATR above 150 pips. The best approach is to compare current ATR to the pair’s historical average over several months to determine relative volatility levels.
Should I use ATR differently during news events?
Yes, during major news events, consider using wider ATR multipliers for stop losses since volatility can spike suddenly. Many traders temporarily switch to 2-3 times ATR instead of their usual 1.5 times during high-impact news periods. Some traders also reduce position sizes during news events regardless of ATR readings to manage additional risk.