The Commodity Channel Index isn’t just another line on your chart – it’s a powerful momentum oscillator that has been helping traders identify overbought and oversold conditions for over four decades. Created by Donald Lambert in 1980, the CCI indicator was originally designed for commodity markets but has proven equally effective across forex, stocks, and other financial instruments.
In today’s volatile forex markets, where currency pairs can swing dramatically within minutes, having a reliable tool to gauge price momentum becomes crucial. The CCI indicator serves as your early warning system, alerting you to potential reversal points and helping you time your entries and exits with greater precision. Whether you’re a scalper looking for quick profits or a swing trader seeking longer-term opportunities, understanding how to properly use the Commodity Channel Index can significantly improve your trading results.
What is the Commodity Channel Index?
The Commodity Channel Index is a momentum-based technical indicator that measures the current price level relative to an average price level over a specific period. Think of it as a sophisticated measuring stick that tells you how far the current price has deviated from its typical behavior. Unlike bounded oscillators that move between fixed levels, the CCI is an unbounded indicator, meaning it can theoretically reach any value above or below its centerline.
What sets the CCI apart from other popular indicators like the Relative Strength Index (RSI) or Moving Average Convergence Divergence (MACD) is its ability to identify cyclical turns in both trending and ranging markets. While RSI focuses on comparing upward and downward price movements, and MACD examines the relationship between two moving averages, the CCI takes a different approach by measuring statistical deviation from the mean.
The indicator operates on the principle that prices tend to return to their average values after extreme moves. This mean-reversion characteristic makes the CCI particularly valuable for identifying potential reversal points in the market. When currency pairs make unusually large moves away from their average price, the CCI signals that a correction might be imminent.
What makes the CCI especially appealing to forex traders is its versatility. It works effectively across all timeframes, from one-minute charts for scalping to daily charts for position trading. This flexibility allows traders to adapt the indicator to their specific trading style and market conditions.
How the CCI Indicator Works
Understanding the mechanics behind the Commodity Channel Index will help you use it more effectively in your trading. The CCI calculation involves three main components: the typical price, a simple moving average of the typical price, and the mean deviation.
The typical price is calculated by adding the high, low, and closing prices of each period and dividing by three. This gives you a more comprehensive view of price action compared to using just the closing price. The simple moving average smooths out short-term fluctuations, while the mean deviation measures how much prices typically vary from this average.
The final CCI value is derived by subtracting the moving average from the current typical price and dividing this difference by the mean deviation multiplied by a constant (0.015). This mathematical formula might sound complex, but the result is elegantly simple: a value that oscillates around zero, with positive values indicating prices above the average and negative values showing prices below the average.
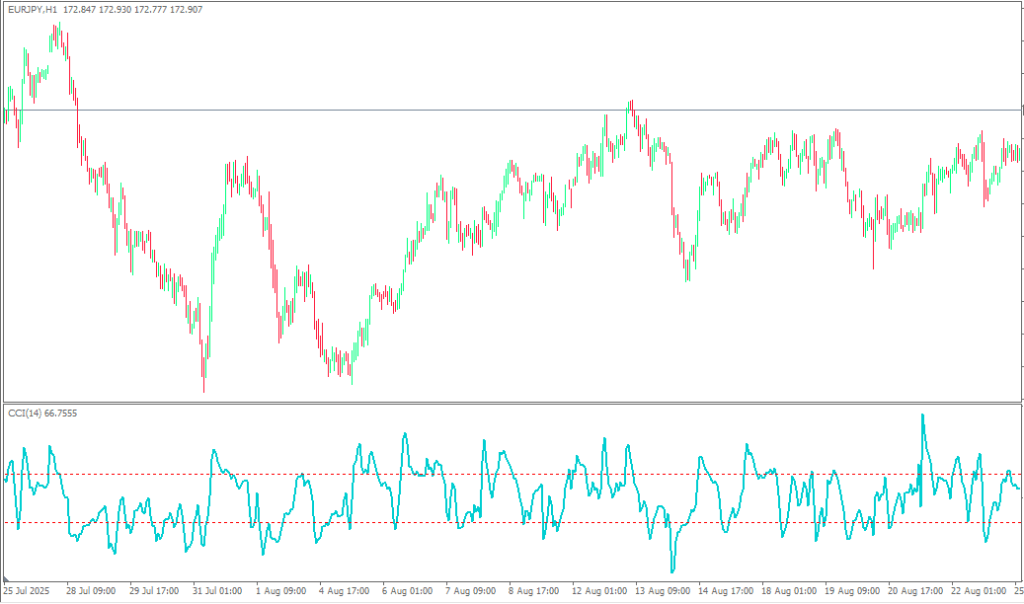
The CCI scale typically ranges from -100 to +100 under normal market conditions, but it can extend well beyond these levels during extreme price movements. This unbounded nature is actually one of the indicator’s strengths, as it can capture the full extent of unusual price action that other oscillators might miss.
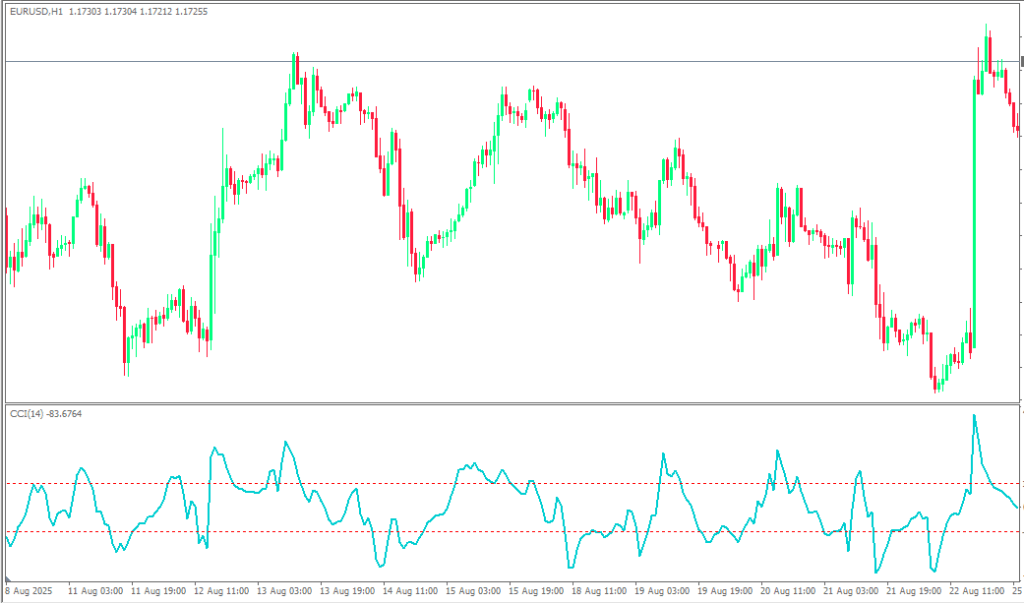
When you see the CCI line on your chart, you’re looking at a visual representation of how current prices compare to recent typical behavior. A CCI reading of +100 suggests that prices are significantly above their average, while a reading of -100 indicates prices are well below normal levels. The further the CCI moves from zero, the more extreme the price deviation becomes.
Understanding CCI Trading Signals
The Commodity Channel Index generates several types of trading signals, each offering unique insights into market behavior. The most fundamental signals come from the indicator’s movement above and below key threshold levels, particularly +100 and -100.
When the CCI rises above +100, it traditionally signals that the currency pair has entered overbought territory. This doesn’t necessarily mean you should immediately sell, but rather that the current upward move may be nearing exhaustion. Experienced traders often use this as a warning to tighten stop losses on long positions or prepare for potential reversal signals.
Conversely, when the CCI drops below -100, it suggests oversold conditions. The price may have declined too far, too fast, and a bounce could be imminent. However, just like with overbought conditions, oversold readings should be viewed as alerts rather than immediate action signals.
Zero line crossovers provide another layer of trading intelligence. When the CCI crosses above zero from negative territory, it indicates that the current typical price has moved above the average, suggesting strengthening momentum. This can be particularly useful for identifying the early stages of new trends or confirming existing upward moves.
Divergence patterns represent some of the most powerful CCI signals. Bullish divergence occurs when price makes lower lows while the CCI makes higher lows, suggesting that downward momentum is weakening despite falling prices. This often precedes significant upward price moves. Bearish divergence, where price makes higher highs while CCI makes lower highs, warns of potential weakness in an uptrend.
The key to successful CCI trading lies in understanding that these signals work best when combined with other forms of analysis. A CCI reading above +100 in a strong uptrend might simply indicate continued strength rather than an immediate reversal opportunity. Context is everything in technical analysis.
Effective CCI Trading Strategies
Implementing the Commodity Channel Index effectively requires understanding different strategic approaches that align with various market conditions and trading styles. The mean reversion strategy represents one of the most straightforward applications of the CCI indicator.
The mean reversion approach assumes that extreme CCI readings will eventually return to more normal levels, creating profit opportunities for contrarian traders. When the CCI moves above +100, you wait for it to start declining back toward the zero line, then enter a short position with the expectation that prices will fall. Similarly, when the CCI drops below -100 and begins rising, you enter a long position anticipating a price bounce.
This strategy works particularly well in ranging markets where currency pairs tend to oscillate between support and resistance levels. For example, if EUR/USD is trading between 1.0800 and 1.0900, extreme CCI readings often coincide with touches of these boundaries, providing clear entry and exit points for mean reversion trades.
Trend following with the CCI takes a different approach, using the indicator to confirm the strength and continuation of existing trends. In this strategy, you look for CCI readings that support the prevailing direction rather than opposing it. During uptrends, you focus on CCI pullbacks to the zero line as buying opportunities, while in downtrends, CCI bounces toward zero become selling opportunities.
The trend-following approach proves especially effective when combined with moving averages or trend lines. If GBP/USD is in a clear uptrend above its 50-period moving average, CCI readings above +100 confirm strong momentum, while pullbacks to the zero line offer low-risk entry points in the direction of the trend.
Divergence trading represents the most sophisticated CCI strategy, requiring patience and careful observation but offering some of the highest-probability setups. When you spot divergence between price and the CCI, you’re seeing early evidence of potential trend changes before they become obvious to other market participants.
Optimizing CCI Settings for Forex Trading
The default 14-period setting for the Commodity Channel Index works well for most trading situations, but understanding how to adjust these parameters can enhance your results in specific market conditions. The period setting determines how many bars the CCI uses in its calculations, directly affecting the indicator’s sensitivity to price changes.
Shorter periods, such as 9 or 10, make the CCI more responsive to price movements, generating signals more frequently. This increased sensitivity can be advantageous for scalping strategies where you need quick signals, but it also increases the likelihood of false signals during choppy market conditions. Many forex scalpers prefer these shorter settings when trading major pairs like EUR/USD or GBP/USD during active market sessions.
Longer periods, such as 20 or 25, smooth out the CCI line and reduce false signals, but at the cost of delayed signal generation. These settings work better for swing trading strategies where you’re looking for more significant price moves and can afford to wait for clearer confirmation. Position traders often use even longer periods, sometimes extending to 50 or more bars for very smooth signals.
The choice of timeframe significantly impacts CCI performance. On shorter timeframes like 5-minute or 15-minute charts, the indicator tends to generate more signals but with higher noise levels. Longer timeframes such as 4-hour or daily charts produce fewer but typically more reliable signals. Many successful forex traders use multiple timeframes, employing longer-term CCI readings for overall direction and shorter-term readings for precise entry timing.
Different currency pairs may respond better to different CCI settings based on their volatility characteristics. Highly volatile pairs like GBP/JPY might benefit from slightly longer periods to filter out excessive noise, while more stable pairs like EUR/CHF might work well with standard or even shorter settings.
Advantages and Limitations of the CCI Indicator
The Commodity Channel Index offers several compelling advantages that make it a valuable addition to any forex trader’s toolkit. Its ability to identify overbought and oversold conditions provides clear visual cues about potential market extremes, helping traders avoid entering positions at poor prices.
Unlike many oscillators that become less effective in strongly trending markets, the CCI maintains its usefulness across different market conditions. In trending markets, it helps identify pullback opportunities and momentum confirmations. In ranging markets, it excels at pinpointing reversal points near support and resistance levels.
The unbounded nature of the CCI allows it to capture extreme price movements that other indicators might miss. During major news events or market disruptions, when currency pairs make unusually large moves, the CCI can extend well beyond normal ranges, providing valuable information about the magnitude of price displacement.
However, the CCI indicator is not without limitations. Like all lagging indicators, it bases its calculations on historical price data, meaning signals always occur after price movements have begun. This inherent delay can result in missed opportunities or late entries that reduce profit potential.
The indicator’s sensitivity to price changes can generate false signals during sideways or choppy market conditions. When currency pairs lack clear direction, the CCI may oscillate frequently around key levels, producing multiple conflicting signals that can lead to whipsaw losses if not properly filtered.
Another limitation lies in the CCI’s inability to predict the duration or magnitude of price moves. While it can signal that a currency pair is overbought or oversold, it cannot tell you how long these conditions will persist or how far prices might move before reversing.
Common CCI Trading Mistakes to Avoid
Many traders make critical errors when implementing the Commodity Channel Index, often leading to frustrating results despite the indicator’s potential. One of the most frequent mistakes is treating CCI signals as standalone trading decisions without considering broader market context.
Relying solely on CCI readings without confirmation from price action, support and resistance levels, or other technical indicators significantly increases the risk of false signals. For instance, a CCI reading above +100 during a strong uptrend might indicate continued strength rather than an immediate reversal opportunity. Always consider the bigger picture before acting on CCI signals.
Poor risk management represents another common pitfall. Some traders become so focused on CCI signals that they neglect proper position sizing, stop loss placement, or profit-taking strategies. Remember that no indicator, including the CCI, has a 100% success rate. Each trade should risk only a small percentage of your account balance, regardless of how confident you feel about the setup.
Overtrading on every CCI signal often leads to death by a thousand cuts. The indicator can generate numerous signals during volatile periods, and attempting to trade them all typically results in high transaction costs and emotional exhaustion. Focus on the highest-quality setups that align with your overall market analysis.
Using inappropriate timeframes for your trading style creates unnecessary complications. Scalpers trying to use daily CCI readings for 5-minute trades, or swing traders relying on 1-minute CCI signals, are mismatching their tools with their objectives. Ensure your CCI timeframe aligns with your intended holding period.
CCI vs Other Popular Indicators
Understanding how the Commodity Channel Index compares to other momentum indicators helps you choose the right tool for specific trading situations. The CCI and RSI both identify overbought and oversold conditions, but they approach this task differently.
The RSI measures the ratio of upward to downward price movements over a specific period, creating a bounded oscillator that moves between 0 and 100. This bounded nature makes RSI readings more standardized across different markets and timeframes. The CCI, with its unbounded scale, can better capture extreme price movements but requires more interpretation to determine significance.
When comparing CCI to the Stochastic oscillator, both indicators help identify potential reversal points, but Stochastic focuses on the relationship between closing prices and the high-low range. This makes Stochastic particularly effective in ranging markets, while CCI’s mean deviation approach works well in both trending and ranging conditions.
The MACD indicator examines relationships between moving averages rather than absolute price levels, making it more effective for trend identification and momentum confirmation. While CCI excels at spotting overbought and oversold conditions, MACD provides clearer signals about trend direction and strength changes.
Many experienced forex traders use combinations of these indicators rather than relying on any single tool. For example, you might use CCI for timing entries in overbought or oversold conditions while using MACD to confirm the overall trend direction.
Putting It All Together
The Commodity Channel Index indicator offers forex traders a robust tool for identifying market extremes and potential reversal points. Its unique approach to measuring price deviation from statistical norms provides valuable insights that complement other forms of technical analysis.
Success with the CCI requires patience, discipline, and a thorough understanding of its strengths and limitations. The indicator works best when used as part of a comprehensive trading strategy that includes proper risk management, market context analysis, and confirmation from other technical tools.
Remember that mastering any trading indicator takes time and practice. Start by observing CCI behavior on your favorite currency pairs across different timeframes and market conditions. Notice how the indicator responds to various price movements and begin to identify patterns that align with your trading style.
The most successful CCI traders understand that the indicator is a guide, not a crystal ball. It provides valuable information about market conditions, but ultimate trading decisions should always consider multiple factors including fundamentals, market sentiment, and overall risk-reward ratios.
Frequently Asked Questions
What is the best timeframe for using the CCI indicator in forex trading?
The optimal timeframe depends on your trading style. For scalping, 5-15 minute charts work well with 9-14 period CCI settings. Swing traders typically prefer 1-4 hour charts with 14-20 period settings, while position traders often use daily or weekly charts with longer periods. Many successful traders use multiple timeframes, checking longer-term CCI for overall direction and shorter-term readings for entry timing.
How do I know when CCI signals are reliable versus false signals?
CCI signals become more reliable when they align with other technical factors such as support/resistance levels, trend direction, and volume patterns. Look for CCI divergences that coincide with key price levels, and avoid trading CCI signals during low-volume periods or major news events. The strongest signals often occur when CCI extremes (+100/-100) coincide with established support or resistance areas.
Can the CCI indicator work effectively in ranging markets?
Yes, the CCI indicator actually performs quite well in ranging markets. In sideways price action, CCI readings above +100 near resistance levels and below -100 near support levels often provide excellent mean reversion trading opportunities. The key is combining CCI signals with clearly defined support and resistance zones to increase the probability of successful trades.
What’s the difference between CCI and RSI, and when should I use each?
The main difference lies in their calculation methods and scaling. RSI is bounded between 0-100 and measures the ratio of up moves to down moves, while CCI is unbounded and measures price deviation from a statistical mean. Use RSI when you want standardized overbought/oversold readings across different markets, and use CCI when you need to capture extreme price movements or prefer mean deviation analysis.
How do I set proper stop losses when trading with CCI signals?
Stop loss placement should be based on price action and market structure rather than CCI levels alone. For CCI reversal trades, place stops beyond recent swing highs or lows, or use percentage-based stops (typically 1-2% for major pairs). For trend-following CCI trades, consider using trailing stops that move in your favor as the trend continues. Never risk more than 1-2% of your account on any single CCI-based trade.