The Moving Average Convergence Divergence, or MACD indicator, isn’t just another line on your chart. It’s one of the most reliable momentum oscillators ever created, capable of identifying trend changes before they become obvious to the naked eye. Whether you’re a complete beginner or someone looking to refine your technical analysis skills, understanding how to properly read and trade MACD signals can be the difference between consistent profits and frustrating losses.
In this comprehensive guide, we’ll break down everything you need to know about the MACD indicator, from its basic components to advanced trading strategies that actually work in real market conditions. By the end of this article, you’ll have the confidence to incorporate MACD into your trading system and start spotting high-probability setups like a seasoned professional.
What is the MACD Indicator and How Does It Work?
The MACD indicator is a trend-following momentum oscillator that reveals the relationship between two moving averages of a security’s price. Created by Gerald Appel in the late 1970s, this powerful tool has stood the test of time because of its simplicity and effectiveness in identifying both trend direction and momentum shifts.
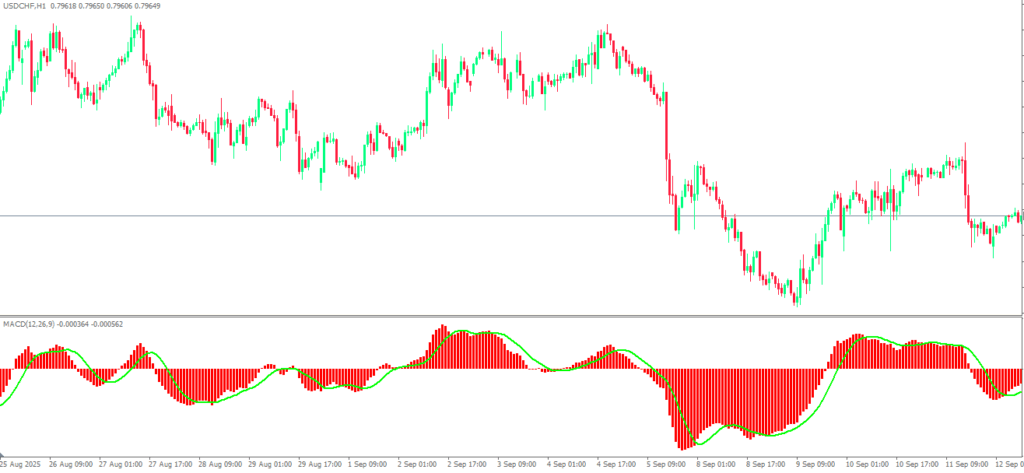
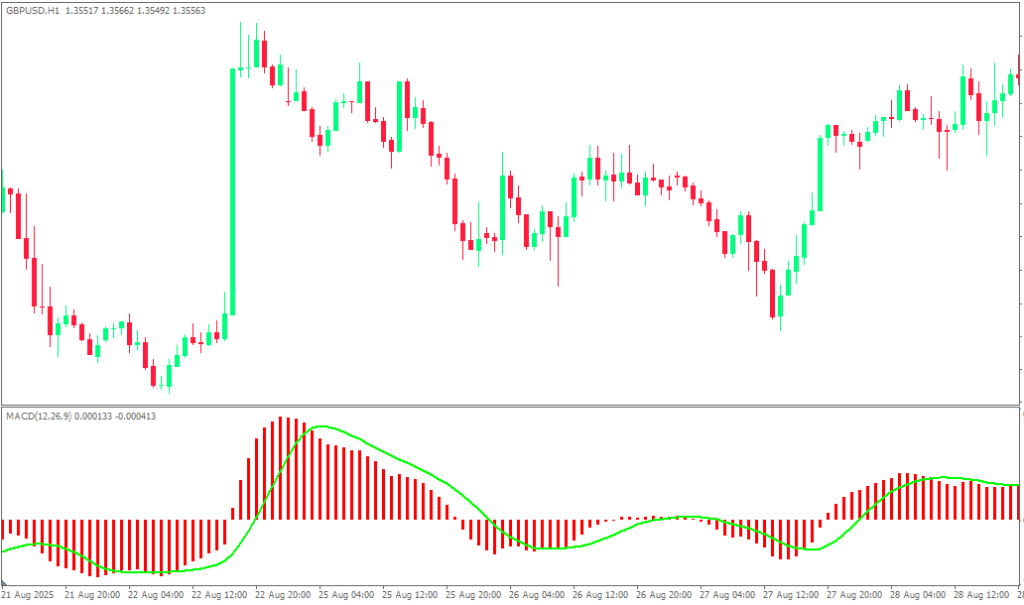
At its core, the MACD consists of three main components that work together to provide trading signals. The MACD line itself is calculated by subtracting the 26-period exponential moving average from the 12-period exponential moving average. This creates a line that oscillates above and below zero, reflecting the momentum of price movements.
The second component is the signal line, which is simply a 9-period exponential moving average of the MACD line. This smoothed version helps filter out noise and provides clearer entry and exit signals. When these two lines interact, they create the crossover signals that many traders base their decisions on.
The third element is the histogram, which represents the difference between the MACD line and the signal line. This histogram provides early warning signs of potential trend changes by showing when momentum is increasing or decreasing, often before the actual crossover occurs.
What makes MACD particularly valuable for forex traders is its ability to work effectively across multiple timeframes. Whether you’re scalping on the 5-minute chart or swing trading on the daily, the indicator adapts to show relevant momentum shifts that align with your trading style.
The Three Essential MACD Trading Signals Every Trader Must Know
Understanding MACD signals is like learning a new language, and once you become fluent, the market starts speaking to you in ways you never noticed before. There are three primary signals that form the foundation of successful MACD trading, each offering unique insights into market behavior.
MACD Line Crossovers: The Foundation of MACD Trading
The most popular and straightforward MACD signal occurs when the MACD line crosses above or below the signal line. A bullish crossover happens when the MACD line crosses above the signal line, suggesting upward momentum is building and potentially signaling a good time to enter long positions. Conversely, a bearish crossover occurs when the MACD line crosses below the signal line, indicating downward momentum and possible short opportunities.
These crossovers work because they represent a shift in the relationship between short-term and long-term momentum. When the 12-period average starts moving faster than the 26-period average in a particular direction, it often signals that a trend is beginning to establish itself. However, experienced traders know that not all crossovers are created equal, and the strongest signals occur when they align with the overall market trend and are confirmed by price action.
The key to successful crossover trading lies in understanding market context. Crossovers that occur near support or resistance levels, or those that coincide with other technical indicators, tend to produce more reliable results than isolated signals in choppy market conditions.
Zero Line Crossovers: Confirming Trend Direction
Zero line crossovers represent another crucial MACD signal that often gets overlooked by novice traders. When the MACD line crosses above the zero line, it indicates that the 12-period EMA has moved above the 26-period EMA, suggesting bullish momentum. When it crosses below zero, it signals that shorter-term momentum has turned bearish.
These zero line crossovers are particularly powerful because they confirm trend direction rather than just momentum shifts. A MACD line consistently above zero suggests a sustained uptrend, while a line below zero indicates a downtrend. This makes zero line crossovers excellent for trend confirmation and helping traders avoid counter-trend trades that often lead to losses.
Many professional traders use zero line crossovers as a filter for their trading systems. They might only take long positions when MACD is above zero and short positions when it’s below, ensuring they’re trading with the dominant trend rather than against it.
MACD Divergence: Early Warning System for Trend Reversals
Perhaps the most sophisticated and profitable MACD signal is divergence, which occurs when price action moves in the opposite direction of the MACD indicator. Bullish divergence happens when price makes lower lows while MACD makes higher lows, suggesting that selling pressure is weakening and a potential reversal to the upside may be imminent.
Bearish divergence is the opposite scenario, where price makes higher highs while MACD makes lower highs, indicating that buying momentum is fading and a downward reversal could be approaching. These divergence signals are particularly valuable because they often occur before obvious price reversals, giving astute traders an edge in timing their entries and exits.
The power of divergence lies in its ability to reveal what’s happening beneath the surface of price action. While price might appear to be trending strongly in one direction, MACD divergence can show that the underlying momentum is actually weakening, providing an early warning system for potential trend changes.
Optimal MACD Settings and Timeframes for Forex Trading
While the default MACD settings of 12, 26, and 9 work well for most trading situations, understanding when and how to adjust these parameters can significantly improve your trading results. These standard settings were originally designed for daily charts and stock trading, but forex markets often require different approaches due to their unique characteristics.
For shorter-term forex trading, many professionals adjust the settings to 8, 17, and 9, which makes the indicator more responsive to price changes and better suited for faster market movements. Day traders and scalpers often prefer even faster settings like 5, 13, and 5, though this increases the number of false signals along with sensitivity.
The timeframe you choose for MACD analysis is equally important as the settings themselves. On shorter timeframes like 1-minute or 5-minute charts, MACD signals can be numerous but less reliable due to market noise. Longer timeframes like 4-hour or daily charts produce fewer but generally more accurate signals that align with significant market moves.
Most successful forex traders use a multi-timeframe approach with MACD, checking longer timeframes for overall trend direction and shorter timeframes for precise entry timing. This method helps ensure that trades align with both short-term momentum and longer-term trend direction, significantly improving win rates and reducing the impact of false signals.
Common MACD Trading Mistakes That Cost Traders Money
Even experienced traders sometimes fall into common MACD traps that can erode trading performance over time. One of the biggest mistakes is relying exclusively on MACD signals without considering other technical factors or market context. MACD works best when combined with support and resistance levels, chart patterns, and other indicators that confirm the signals it generates.
Another frequent error is overtrading based on every MACD crossover or signal, especially in sideways or choppy market conditions. Not every signal deserves action, and learning to filter out low-probability setups is crucial for long-term profitability. The best MACD signals often occur after periods of consolidation or at significant technical levels where multiple factors align.
Many traders also make the mistake of using inappropriate timeframes for their trading style. A scalper using MACD signals from a daily chart will miss most short-term opportunities, while a swing trader acting on 5-minute MACD signals will likely get stopped out by normal market noise. Matching your MACD timeframe to your trading horizon is essential for consistent results.
Perhaps the most costly mistake is ignoring risk management principles when trading MACD signals. No indicator, including MACD, is right 100% of the time, and proper position sizing and stop-loss placement are crucial for surviving the inevitable losing trades that every system produces.
MACD vs Other Popular Trading Indicators
Understanding how MACD compares to other popular technical indicators helps traders choose the right tools for their specific market analysis needs. While RSI measures overbought and oversold conditions, MACD focuses on momentum and trend direction, making them complementary rather than competing tools. Many successful trading systems combine MACD’s trend-following capabilities with RSI’s mean-reversion signals.
Compared to simple moving averages, MACD provides more nuanced information about momentum changes and trend strength. While moving average crossovers can be effective, they often lag significantly behind price movements. MACD’s histogram component provides earlier warnings of potential trend changes, giving traders a timing advantage.
Stochastic oscillators share some similarities with MACD in terms of momentum measurement, but Stochastic is more sensitive to short-term price changes and works better in ranging markets. MACD excels in trending markets where its longer-term perspective helps identify sustained moves rather than temporary fluctuations.
The key insight is that no single indicator provides a complete picture of market conditions. MACD’s strength lies in trend identification and momentum measurement, but it should be part of a broader analytical framework that includes price action analysis and other technical tools.
A Simple but Effective MACD Trading Strategy
Building a practical MACD trading strategy requires combining the signals we’ve discussed with proper risk management and market context analysis. The most effective approach starts with identifying the overall trend using a longer timeframe, then using shorter timeframe MACD signals for entry timing.
Begin by analyzing the daily or 4-hour chart to determine the dominant trend direction using zero line crossovers and the general position of the MACD line. When MACD is above zero on higher timeframes, focus on bullish signals on shorter timeframes. When it’s below zero, look for bearish opportunities.
For actual trade entry, wait for MACD line crossovers on your chosen trading timeframe, but only when they align with the higher timeframe trend. This approach significantly improves the probability of successful trades by ensuring you’re not fighting the dominant market direction.
Confirmation from price action adds another layer of reliability to MACD signals. Look for crossovers that occur near significant support or resistance levels, or those that coincide with chart pattern breakouts or breakdowns. This confluence of factors often produces the highest probability trade setups.
Exit strategies should combine MACD signals with logical profit targets and stop losses. Consider taking partial profits when MACD shows signs of momentum weakening, even if no clear reversal signal has occurred yet. This approach helps lock in gains while allowing room for trades to develop fully.
Maximizing MACD Performance in Different Market Conditions
Market conditions significantly impact MACD effectiveness, and successful traders adjust their approach based on whether markets are trending, ranging, or transitioning between these states. In strong trending markets, MACD crossovers and zero line breaks tend to produce their most reliable signals, with the indicator helping traders stay positioned with the dominant trend.
During ranging or sideways market conditions, MACD signals become less reliable as the indicator oscillates around the zero line without clear directional bias. In these conditions, divergence signals often work better than crossovers, as they can identify potential breakout points before obvious price movements occur.
Volatile market periods require additional caution when interpreting MACD signals, as rapid price movements can create false crossovers and whipsaws. During high-impact news events or major market announcements, it’s often better to wait for price to settle before acting on MACD signals.
Experienced traders also recognize that MACD performance varies across different currency pairs. Major pairs like EUR/USD and GBP/USD often respond well to standard MACD analysis, while exotic pairs might require adjusted settings or additional confirmation due to their unique trading characteristics and lower liquidity.
Taking Your MACD Trading to the Next Level
Mastering the MACD indicator is not about memorizing signals or blindly following crossovers. It’s about understanding market momentum, recognizing when conditions favor trend continuation versus reversal, and combining this knowledge with sound risk management principles to build a sustainable trading approach.
The traders who profit consistently with MACD understand that it’s a tool for reading market sentiment and momentum, not a crystal ball that predicts the future with certainty. They use it as part of a comprehensive trading system that includes proper position sizing, risk management, and market context analysis.
Remember that becoming proficient with any technical indicator takes time and practice. Start by paper trading or using demo accounts to test your MACD strategies without risking real money. Keep detailed records of your trades to identify which signals work best in different market conditions and timeframes.
Most importantly, never stop learning and adapting your approach. Markets evolve constantly, and the most successful traders are those who continuously refine their skills and adjust their strategies to match changing market dynamics.
Your journey to MACD mastery starts with understanding these foundational concepts, but it’s perfected through consistent application and continuous improvement. Take the time to practice these techniques, and you’ll soon discover why so many professional traders consider MACD an indispensable part of their trading arsenal.
Frequently Asked Questions About MACD Indicator
What does MACD stand for and what does it measure?
MACD stands for Moving Average Convergence Divergence. It measures momentum by showing the relationship between two exponential moving averages (typically 12 and 26 periods). The indicator reveals whether momentum is increasing or decreasing and helps identify trend changes through crossovers, zero line breaks, and divergence patterns.
What are the best MACD settings for forex trading?
The default settings of 12, 26, and 9 work well for most forex trading situations. However, short-term traders often use faster settings like 8, 17, 9 or even 5, 13, 5 for more responsive signals. Day traders and scalpers prefer faster settings, while swing traders stick with standard or even slower parameters like 19, 39, 9 for more reliable signals
How do you read MACD crossover signals correctly?
A bullish crossover occurs when the MACD line crosses above the signal line, suggesting upward momentum. A bearish crossover happens when the MACD line crosses below the signal line, indicating downward momentum. The strongest crossovers occur when they align with the overall trend direction and happen near significant support or resistance levels.
What is MACD divergence and why is it important?
MACD divergence occurs when price moves in the opposite direction of the MACD indicator. Bullish divergence shows price making lower lows while MACD makes higher lows, suggesting potential upward reversal. Bearish divergence shows price making higher highs while MACD makes lower highs, indicating possible downward reversal. Divergence often provides early warning signals before obvious trend changes.
Can MACD be used alone for trading decisions?
While MACD is a powerful indicator, it should not be used alone for trading decisions. It works best when combined with other technical analysis tools like support and resistance levels, chart patterns, and additional indicators. Using MACD in isolation can lead to false signals and poor trading results, especially in choppy or sideways markets.