
If you’ve ever found yourself caught in choppy, sideways markets or struggled to determine whether a trend has real strength behind it, the ADX indicator might be the missing piece in your trading puzzle. This powerful tool, developed by legendary trader Welles Wilder in 1978, doesn’t predict price direction but instead measures something far more valuable: the strength of existing trends.
Understanding trend strength is crucial for forex traders because it helps you avoid weak, unreliable price movements while identifying the powerful trends that can deliver substantial profits. In this comprehensive guide, we’ll explore everything you need to know about the ADX indicator, from its basic mechanics to advanced trading strategies that professional traders use daily.
What is the ADX Indicator?
The Average Directional Index (ADX) is a technical analysis tool that measures the strength of a trend without regard to its direction. Created by Welles Wilder in 1978 as part of his Directional Movement System, the ADX has become one of the most reliable indicators for trend strength analysis across all financial markets.
Unlike moving averages or oscillators that attempt to predict future price movements, the ADX focuses solely on quantifying how strong the current trend is. This unique characteristic makes it invaluable for forex traders who need to distinguish between powerful, tradeable trends and weak price movements that are likely to reverse or stagnate.
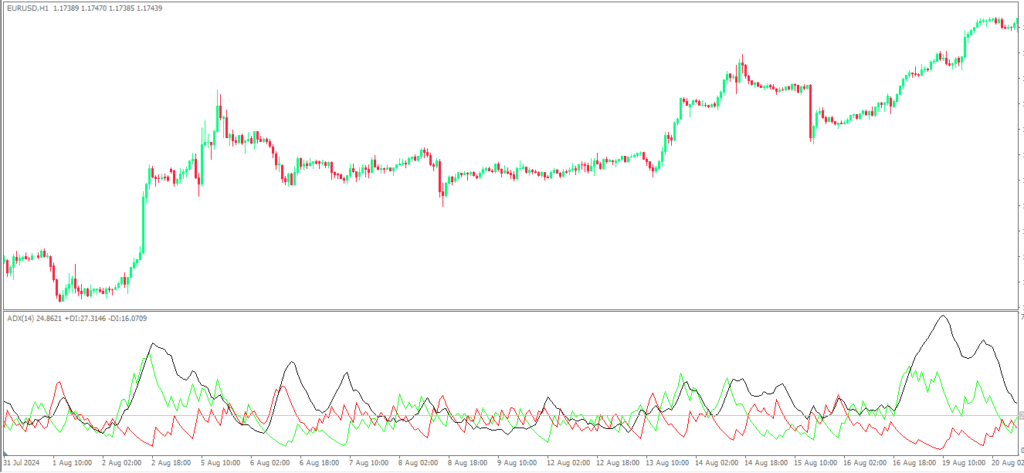
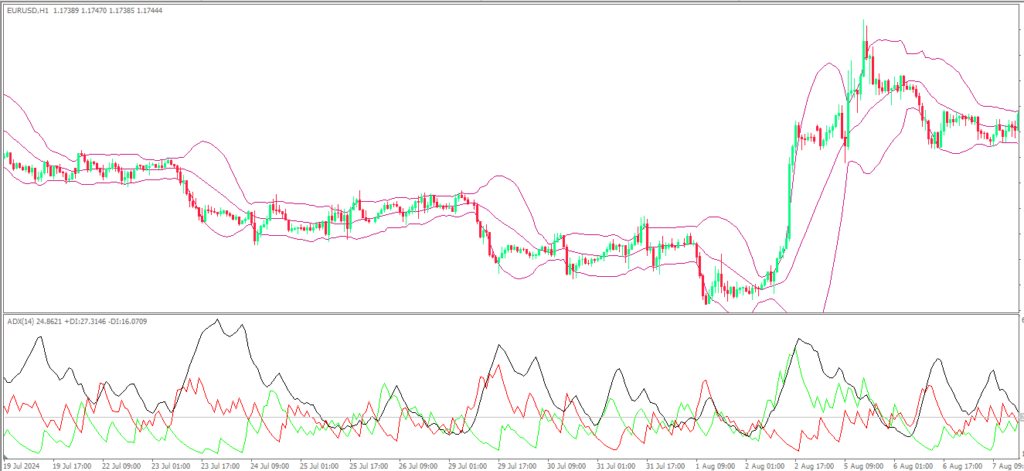
The ADX operates on a scale from 0 to 100, where higher values indicate stronger trends regardless of whether the market is moving up or down. The indicator consists of three main components: the ADX line itself, which measures trend strength, and two additional lines called +DI (Positive Directional Indicator) and -DI (Negative Directional Indicator) that help determine trend direction.
The mathematical foundation of the ADX involves complex calculations based on the relationship between current high and low prices compared to previous periods. However, you don’t need to understand the mathematics to use the indicator effectively. What matters is recognizing that the ADX provides objective, quantifiable data about market momentum that can significantly improve your trading decisions.
How to Read ADX Values Like a Pro
Reading ADX values correctly is fundamental to successful trend analysis. The indicator’s 0-100 scale provides clear benchmarks that professional traders use to categorize market conditions and make informed trading decisions.
When the ADX reads below 25, it indicates a weak trend or ranging market conditions. During these periods, prices typically move sideways with little directional conviction, making trend-following strategies less effective. Many experienced traders avoid taking new positions when the ADX is below this threshold, instead waiting for stronger trend signals to emerge.
An ADX reading above 25 signals the presence of a strong trend. This is where trend-following strategies become most profitable, as the market demonstrates clear directional momentum. The higher the ADX climbs above 25, the stronger the trend becomes, providing traders with increased confidence in their directional bias.
Extremely strong trends occur when the ADX rises above 50. These situations often represent the most profitable trading opportunities, as prices tend to move decisively in one direction with minimal corrections. However, it’s important to remember that very high ADX readings can also signal trend exhaustion, particularly when the indicator begins to decline from extreme levels.
The direction of the ADX line itself provides additional insights. A rising ADX indicates strengthening trend conditions, while a falling ADX suggests weakening momentum. This information helps traders time their entries and exits more precisely, entering positions as trends gain strength and exiting as momentum begins to fade.
Powerful ADX Trading Strategies
The trend strength strategy represents one of the most straightforward applications of the ADX indicator. This approach involves entering trades only when the ADX confirms strong trending conditions, typically when the indicator rises above 25. Traders using this strategy wait for the ADX to cross above the 25 level before considering new positions, ensuring they only trade during periods of genuine market momentum.
The key to success with the trend strength strategy lies in combining ADX readings with directional indicators. While the ADX tells you when a strong trend exists, you need additional information to determine whether that trend is bullish or bearish. This is where the +DI and -DI components become crucial. When +DI is above -DI and the ADX is rising above 25, it suggests a strong uptrend is developing. Conversely, when -DI exceeds +DI with a rising ADX, it indicates strong downward momentum.
Another sophisticated approach involves using ADX crossover strategies in conjunction with other technical indicators. Professional traders often combine ADX signals with moving average crossovers or support and resistance levels to create more robust trading systems. For example, you might look for long opportunities when the ADX rises above 25, the +DI crosses above the -DI, and price breaks above a key resistance level simultaneously.
The ADX divergence strategy offers another powerful application for experienced traders. This approach involves looking for situations where price makes new highs or lows while the ADX fails to confirm with corresponding strength readings. Such divergences often signal potential trend reversals or periods of consolidation, providing valuable timing information for position adjustments.
Successful ADX trading also requires understanding the indicator’s relationship with different market phases. During trending markets, the ADX provides excellent guidance for trade entry and exit timing. However, during ranging or consolidating markets, the indicator’s signals become less reliable, requiring traders to adjust their strategies accordingly.
Optimizing ADX Indicator Settings
The default ADX period setting of 14 has stood the test of time and remains the most widely used configuration among professional traders. This 14-period setting provides a balanced approach that captures meaningful trend changes without being overly sensitive to short-term price fluctuations. The setting was carefully chosen by Welles Wilder based on extensive market testing and continues to work effectively across different timeframes and currency pairs.
However, traders operating in different market conditions or timeframes may benefit from adjusting these settings. A shorter period setting, such as 7, makes the ADX more responsive to recent price action but also increases the likelihood of false signals. This configuration works well for scalpers and day traders who need quick confirmation of short-term momentum changes.
Longer period settings, such as 21 or 28, create a smoother ADX line that filters out minor market noise but responds more slowly to genuine trend changes. Swing traders and position traders often prefer these longer settings because they align better with their extended holding periods and help avoid premature exits from profitable positions.
The timeframe you choose for analysis significantly impacts ADX effectiveness. On higher timeframes like daily or weekly charts, the ADX provides more reliable signals with fewer false readings. These timeframes are particularly useful for identifying major trend changes that can last for weeks or months. Shorter timeframes, such as 15-minute or hourly charts, offer more frequent signals but require careful filtering to avoid overtrading in choppy market conditions.
Most modern trading platforms, including MetaTrader 4, TradingView, and ThinkOrSwim, offer built-in ADX indicators with customizable settings. The indicator is readily available and easy to apply to any currency pair or timeframe, making it accessible to traders at all experience levels.
Understanding ADX Advantages and Limitations
The ADX indicator offers several compelling advantages that explain its widespread adoption among professional traders. Its primary strength lies in providing objective, quantifiable measurements of trend strength that remove emotional bias from trading decisions. Unlike subjective chart patterns or support and resistance levels, ADX readings offer clear numerical values that help standardize trade analysis across different market conditions.
Another significant advantage is the ADX’s versatility across different market environments and timeframes. Whether you’re trading major currency pairs like EUR/USD or exotic pairs with unique characteristics, the ADX adapts to various market conditions and provides consistent trend strength readings. This reliability makes it valuable for both discretionary traders who make subjective decisions and systematic traders who rely on algorithmic approaches.
The ADX also excels at filtering out weak, unreliable price movements that often trap inexperienced traders. By requiring minimum trend strength thresholds before entering positions, traders can avoid many of the false breakouts and whipsaws that plague trending strategies during ranging market conditions.
However, the ADX has limitations that traders must understand to use it effectively. As a lagging indicator, it confirms trends after they’ve already begun rather than predicting future movements. This characteristic means traders using ADX signals may miss the very beginning of new trends or receive exit signals after optimal exit points have passed.
The ADX also provides no information about price direction on its own. While it tells you when strong trends exist, you need additional indicators or analysis methods to determine whether those trends are bullish or bearish. This limitation requires traders to develop more comprehensive trading systems that incorporate multiple analytical tools.
Additionally, extreme ADX readings above 50 can sometimes signal trend exhaustion rather than continuation. Paradoxically, the strongest ADX readings may occur near trend tops or bottoms, requiring traders to exercise caution when the indicator reaches extreme levels.
Common ADX Trading Mistakes to Avoid
One of the most frequent mistakes forex traders make with the ADX indicator is using it for directional signals rather than trend strength analysis. Many beginners assume the ADX tells them whether to buy or sell, but this misunderstanding leads to poor trading decisions. The ADX only measures how strong a trend is, not which direction it’s moving. Always combine ADX readings with directional indicators or price action analysis to determine appropriate trade direction.
Another critical error involves ignoring broader market context when interpreting ADX signals. A rising ADX reading above 25 doesn’t automatically mean you should enter a trade if other factors suggest caution. Consider economic events, key support and resistance levels, and overall market sentiment before acting on ADX signals. The indicator works best as one component of a comprehensive trading strategy rather than a standalone decision-making tool.
Over-reliance on the ADX indicator represents another common pitfall. While the indicator provides valuable trend strength information, successful trading requires multiple forms of analysis. Traders who base decisions solely on ADX readings often miss important market nuances that could affect trade outcomes. Develop a balanced approach that incorporates price action, fundamental analysis, and other technical indicators alongside ADX signals.
Timeframe misalignment creates problems for many ADX users. Using very short timeframes like 1-minute or 5-minute charts often produces excessive noise and false signals that can lead to overtrading. Conversely, using timeframes that are too long for your trading style may cause you to miss relevant opportunities or hold positions longer than appropriate for your risk tolerance.
Finally, many traders fail to adjust their ADX interpretation based on different market conditions. The indicator behaves differently during trending versus ranging markets, requiring flexible approaches rather than rigid rule-following. Develop the ability to recognize when market conditions favor ADX-based strategies and when alternative approaches might be more appropriate.
Mastering ADX for Long-Term Trading Success
The ADX indicator represents a powerful tool for forex traders seeking to improve their trend analysis and timing. By focusing on trend strength rather than direction, it provides unique insights that can significantly enhance trading performance when used correctly. The key to success lies in understanding that the ADX works best as part of a comprehensive trading approach rather than as a standalone solution.
Remember that effective ADX trading requires patience and discipline. Wait for clear signals when the indicator rises above 25 and confirm directional bias through additional analysis. Avoid the temptation to trade during weak trend periods indicated by low ADX readings, even if other indicators suggest potential opportunities.
The most successful ADX traders develop the ability to read market context and adjust their strategies accordingly. They understand when trending conditions favor ADX-based approaches and when ranging markets require different tactics. This adaptability, combined with proper risk management and realistic expectations, forms the foundation of profitable long-term trading.
As you continue developing your forex trading skills, consider incorporating the ADX indicator into your analytical toolkit. Start with the default 14-period setting on higher timeframes to build familiarity with the indicator’s behavior. Gradually experiment with different settings and strategies as your understanding deepens, always maintaining focus on trend strength analysis rather than directional predictions.
Take action today by adding the ADX indicator to your charts and observing how it behaves across different currency pairs and market conditions. Practice identifying strong versus weak trend periods, and begin developing rules for when to trade and when to wait. Your future trading success may depend on mastering this fundamental aspect of technical analysis.
Frequently Asked Questions
What does an ADX reading of 30 mean?
An ADX reading of 30 indicates a moderately strong trend is present in the market. This level suggests the trend has sufficient momentum to potentially continue, making it suitable for trend-following strategies. Readings above 25 are generally considered the threshold for tradeable trends, so 30 represents a solid trend strength level.
Can ADX be used for all currency pairs?
Yes, the ADX indicator works effectively across all major, minor, and exotic currency pairs. The mathematical calculations underlying ADX are based on price movement relationships that exist in all liquid markets. However, exotic pairs with lower liquidity may produce more erratic ADX readings due to irregular price action.
How do I know when an ADX trend is ending?
An ADX trend typically begins weakening when the indicator starts declining from high levels, particularly when it falls below 25. Additionally, when the ADX reaches extreme readings above 50, it may signal trend exhaustion rather than continuation. Watch for divergences between price and ADX, where price makes new highs/lows but ADX fails to confirm with higher readings.
Should I use different ADX settings for different timeframes?
While the default 14-period setting works well across most timeframes, you may benefit from adjustments based on your trading style. Shorter timeframes (1-hour or less) might work better with slightly longer periods like 21 to reduce noise. Longer timeframes (daily or weekly) can effectively use shorter periods like 7-10 for more responsive signals.
What’s the difference between ADX and other trend indicators like moving averages?
Unlike moving averages that show price direction and potential support/resistance levels, ADX exclusively measures trend strength without regard to direction. Moving averages can give directional signals but don’t quantify how strong the trend is. ADX tells you when conditions favor trend-following strategies, while moving averages help determine which direction to trade.