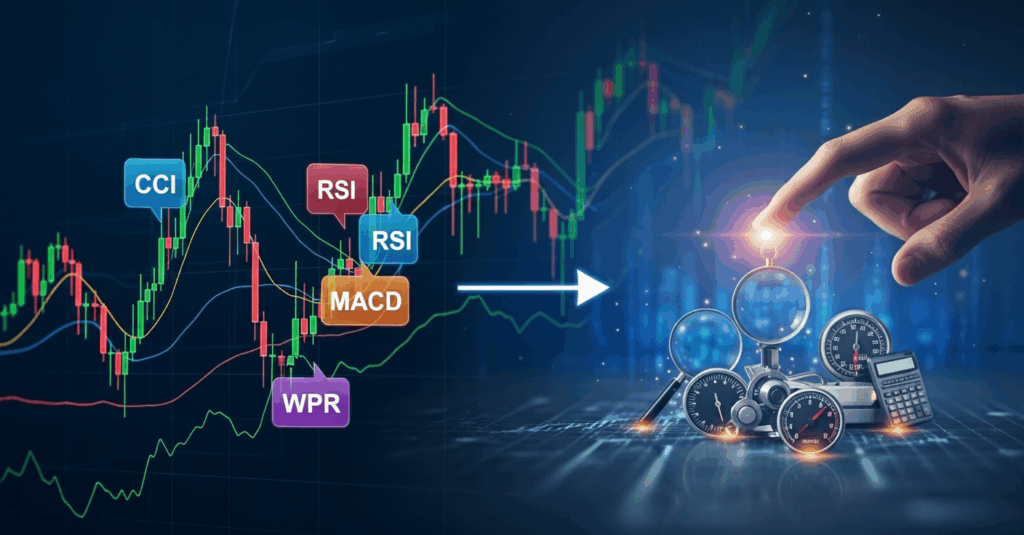
While there’s no crystal ball in trading, certain technical indicators have proven themselves time and again as reliable tools for analyzing market movements. These indicators don’t guarantee profits, but they do provide the analytical framework that separates systematic traders from gamblers.
The challenge isn’t finding indicators—most trading platforms offer dozens of them. The real challenge is knowing which ones work best for different market conditions, how to use them effectively, and most importantly, how to avoid the common trap of analysis paralysis that comes from using too many at once.
In this guide, we’ll explore the most effective forex indicators that professional traders rely on, understand how each one works, and learn when to apply them. Whether you’re a beginner looking to build your first trading system or an experienced trader seeking to refine your approach, this article will provide you with the insights needed to make informed decisions about which indicators deserve a place on your charts.
Understanding Forex Indicators: The Foundation of Technical Analysis
Before diving into specific indicators, it’s crucial to understand what forex indicators actually are and how they function within your trading strategy. Think of indicators as sophisticated mathematical calculations that take raw price data and transform it into visual representations that are easier to interpret and analyze.
Forex indicators serve as your analytical toolkit, each designed to reveal different aspects of market behavior. Some indicators excel at identifying trends, while others specialize in spotting potential reversal points or measuring market momentum. The key to successful indicator usage lies in understanding that each one provides a unique perspective on the same underlying price action.

The indicator landscape can be broadly categorized into two main types: leading and lagging indicators. Leading indicators, such as the Relative Strength Index (RSI) or Stochastic Oscillator, attempt to predict future price movements by identifying overbought or oversold conditions. These indicators can provide early signals but are also more prone to false alarms. Lagging indicators, like moving averages, confirm trends that are already in motion. While they may not catch the very beginning of a move, they tend to be more reliable once a trend is established.
Another important distinction exists between trend-following indicators and oscillators. Trend-following indicators work best when markets are moving directionally, helping you ride the wave of established trends. Oscillators, on the other hand, shine in range-bound markets where prices bounce between defined levels. Understanding these fundamental differences will help you choose the right tool for the current market environment.
Moving Averages: The Cornerstone of Technical Analysis
Moving averages represent the most fundamental and widely used forex indicators, and for good reason. These indicators smooth out price fluctuations by calculating the average price over a specific number of periods, creating a clearer picture of the underlying trend direction. The beauty of moving averages lies in their simplicity and versatility—they work across all timeframes and currency pairs.
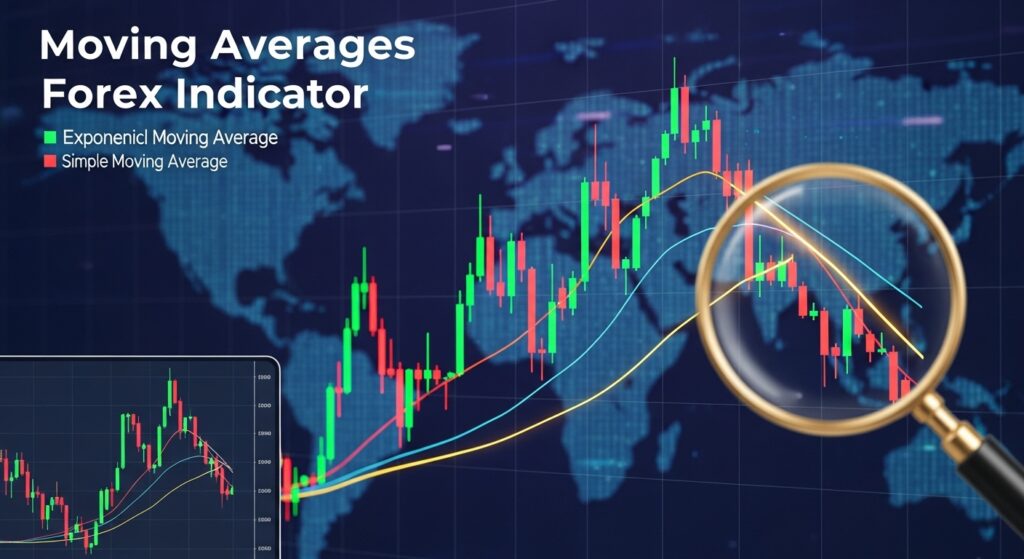
The two primary types of moving averages are Simple Moving Averages (SMA) and Exponential Moving Averages (EMA). A Simple Moving Average calculates the arithmetic mean of closing prices over a specified period, giving equal weight to each data point. For example, a 20-period SMA on a daily chart would add up the closing prices of the last 20 days and divide by 20. This creates a smooth line that represents the average price over that period.
Exponential Moving Averages take a more sophisticated approach by giving greater weight to recent prices while still considering historical data. This makes EMAs more responsive to current price action, allowing them to react faster to trend changes. Many professional traders prefer EMAs for this reason, as they provide earlier signals while maintaining the smoothing benefits of traditional moving averages.
The most commonly used moving average periods are 20, 50, 100, and 200. Each serves a different purpose in market analysis. The 20-period moving average is excellent for short-term trend analysis and acts as dynamic support and resistance. When price trades above the 20 MA, it suggests bullish momentum, while trading below indicates bearish pressure. The 50-period moving average serves as a medium-term trend gauge, while the 200-period moving average is considered the gold standard for long-term trend identification.
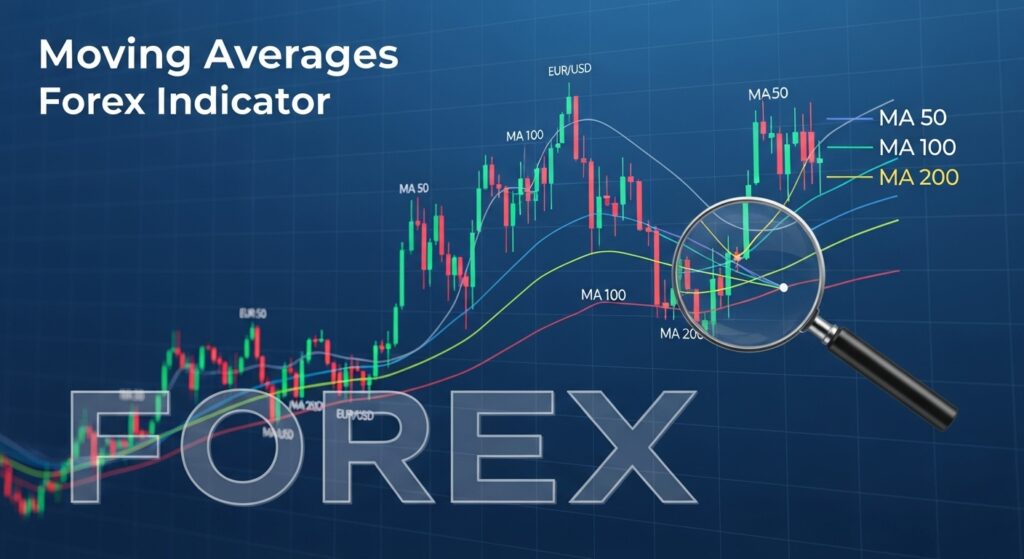
Professional traders often use multiple moving averages together to create powerful trading systems. When a shorter-period moving average crosses above a longer-period one, it generates a bullish signal known as a “golden cross.” Conversely, when the shorter average crosses below the longer one, it creates a “death cross,” signaling potential downward momentum. These crossover signals work particularly well in trending markets but can produce false signals in choppy, sideways conditions.
Moving averages also function as dynamic support and resistance levels. In uptrends, price often bounces off rising moving averages, using them as support for continuation moves higher. Similarly, in downtrends, moving averages can act as resistance, capping rally attempts and providing entry points for short positions.
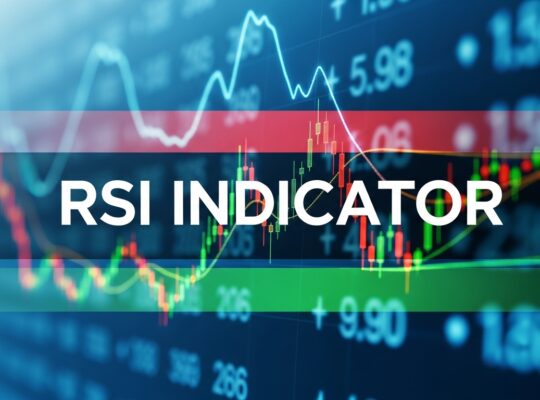
Relative Strength Index: Mastering Momentum Analysis
The Relative Strength Index, commonly known as RSI, stands as one of the most powerful momentum oscillators in a trader’s arsenal. Developed by J. Welles Wilder in 1978, the RSI measures the speed and change of price movements, oscillating between 0 and 100. This indicator excels at identifying overbought and oversold conditions, making it invaluable for timing entry and exit points.
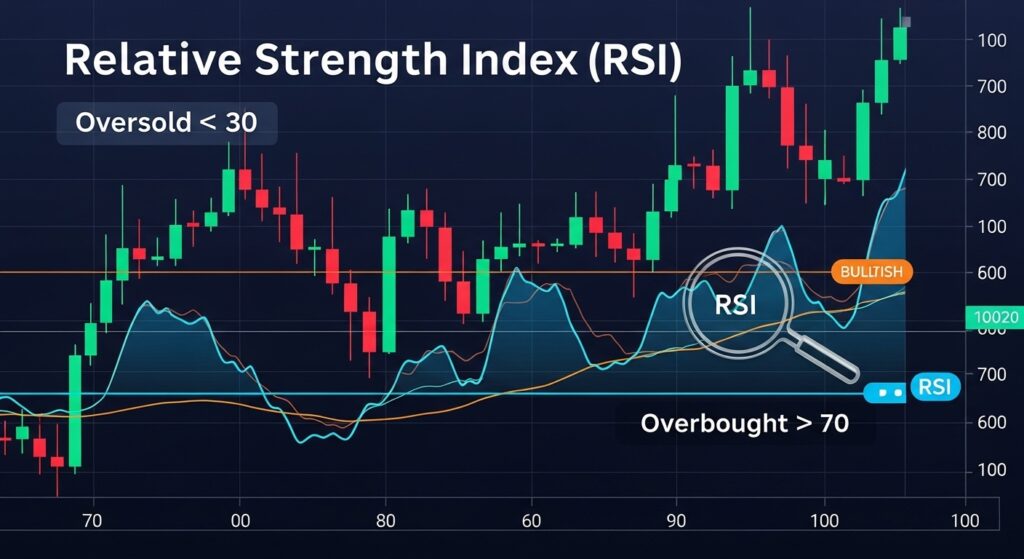
The RSI’s calculation compares the magnitude of recent gains to recent losses over a specified period, typically 14 periods. When the RSI reads above 70, it traditionally indicates that a currency pair may be overbought and due for a pullback. Conversely, readings below 30 suggest oversold conditions and potential buying opportunities. However, experienced traders know that these levels aren’t rigid rules but rather guidelines that should be interpreted within the broader market context.
One of the RSI’s most powerful applications lies in divergence analysis. Bullish divergence occurs when price makes lower lows while the RSI makes higher lows, suggesting underlying strength that may lead to an upward reversal. Bearish divergence presents the opposite scenario—price makes higher highs while RSI shows lower highs, indicating potential weakness and a possible downward move.
The RSI’s effectiveness varies significantly across different market conditions. In strongly trending markets, the RSI can remain in overbought or oversold territory for extended periods, making traditional level-based signals less reliable. During these conditions, traders often adjust their approach by using more extreme levels (80/20 instead of 70/30) or focusing on divergence patterns rather than absolute levels.
For forex trading specifically, the RSI works exceptionally well with major currency pairs like EUR/USD, GBP/USD, and USD/JPY, as these pairs tend to exhibit more predictable momentum patterns. The indicator is less reliable with exotic currency pairs, which often experience more erratic price movements due to lower liquidity and higher volatility.
Many successful traders combine RSI with other indicators to create more robust trading systems. A popular combination involves using RSI for momentum analysis while employing moving averages for trend direction. This approach helps filter out false signals by ensuring that RSI signals align with the overall trend direction.
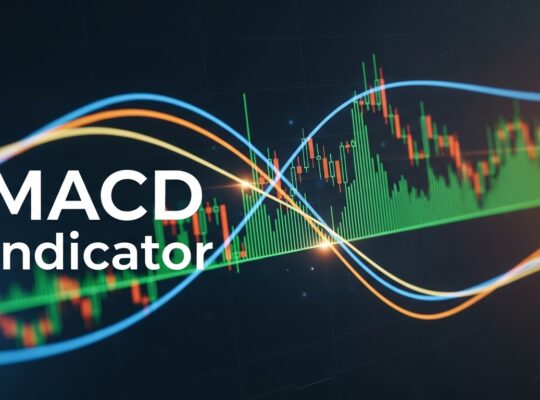
MACD: The Swiss Army Knife of Trading Indicators
The Moving Average Convergence Divergence, or MACD, represents one of the most versatile and widely adopted forex indicators available to traders. Created by Gerald Appel in the late 1970s, MACD combines trend-following and momentum characteristics in a single, powerful tool that provides multiple types of trading signals.
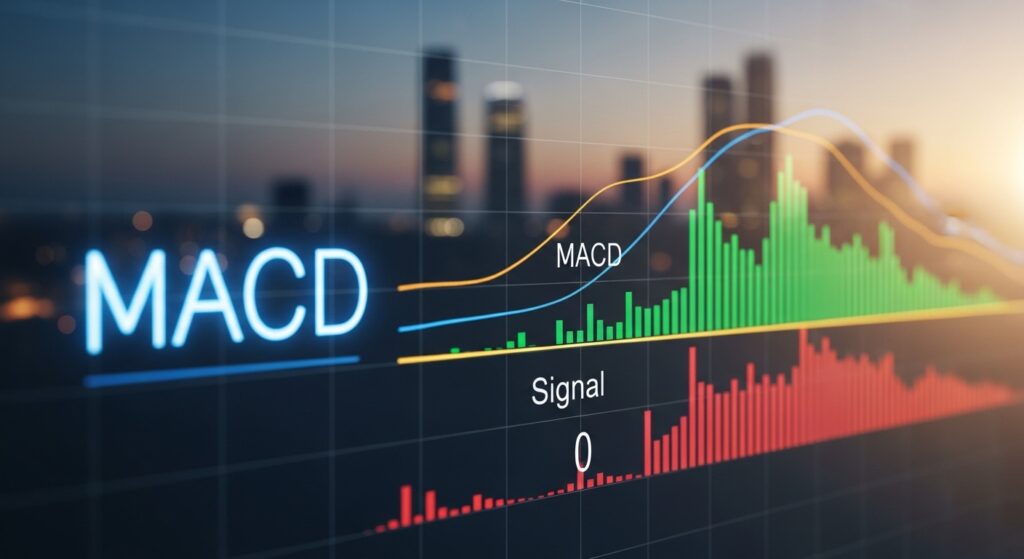
MACD consists of three main components: the MACD line, the signal line, and the histogram. The MACD line is calculated by subtracting a longer-period exponential moving average (typically 26 periods) from a shorter-period EMA (usually 12 periods). The signal line is a 9-period EMA of the MACD line itself. The histogram represents the difference between the MACD line and the signal line, providing a visual representation of the convergence and divergence between these two elements.
The most basic MACD signal occurs when the MACD line crosses above or below the signal line. A bullish crossover happens when the MACD line crosses above the signal line, suggesting upward momentum is building. A bearish crossover occurs when the MACD line drops below the signal line, indicating potential downward pressure. These crossover signals work best when they occur away from the zero line, as signals near zero tend to be less reliable.
Zero line crossovers provide another layer of analysis. When the MACD line crosses above the zero line, it indicates that the 12-period EMA has moved above the 26-period EMA, suggesting bullish momentum. Conversely, crosses below the zero line signal potential bearish conditions. These zero line crossovers often correspond with significant trend changes and are particularly valuable for identifying the strength of emerging trends.
The MACD histogram offers additional insights into momentum dynamics. When the histogram is expanding (bars getting taller), it indicates that momentum is increasing in the direction of the trend. Contracting histogram bars suggest momentum is waning, potentially signaling trend exhaustion. Many traders watch for histogram reversals as early warning signs of potential trend changes.
Like the RSI, MACD excels at divergence analysis. Bullish divergence occurs when price makes lower lows while MACD makes higher lows, suggesting that selling pressure is diminishing. Bearish divergence presents when price reaches higher highs while MACD fails to confirm with higher highs, indicating potential weakness in the uptrend.
MACD’s versatility makes it suitable for various trading styles and timeframes. Day traders often use MACD on shorter timeframes (5-minute to 1-hour charts) to identify momentum shifts within the trading day. Swing traders typically apply MACD to 4-hour and daily charts to capture medium-term trend changes. The indicator’s reliability tends to improve on higher timeframes, where noise is reduced and significant trend movements are more apparent.
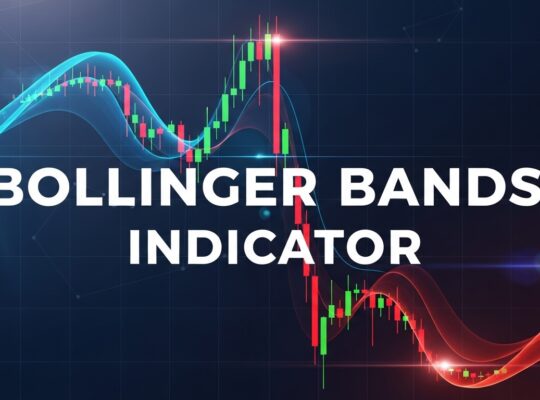
Bollinger Bands: Volatility and Mean Reversion Mastery
Bollinger Bands, developed by John Bollinger in the 1980s, represent a sophisticated approach to analyzing price volatility and identifying potential reversal points. This indicator consists of three lines: a simple moving average in the center (typically 20 periods) flanked by two bands that are placed at a specified number of standard deviations (usually 2) above and below the moving average.

The genius of Bollinger Bands lies in their dynamic nature. Unlike fixed support and resistance levels, these bands expand and contract based on market volatility. During periods of high volatility, the bands widen to accommodate larger price swings. In low-volatility environments, the bands contract, creating a tighter range around the moving average. This adaptive quality makes Bollinger Bands particularly effective for analyzing different market conditions.
One of the most powerful Bollinger Band signals occurs during periods of low volatility known as “squeezes.” When the bands contract significantly, it often precedes explosive price movements as markets break out of their consolidation phases. Traders watch for these squeeze patterns as they frequently lead to significant trending moves in either direction. The key is patience—waiting for the breakout and then riding the subsequent momentum.
The bands themselves serve as dynamic support and resistance levels. In trending markets, price often walks along one band or the other, using it as a guide for the trend’s continuation. During uptrends, price frequently finds support at or near the lower band, while downtrends see price resistance near the upper band. These “band walks” can continue for extended periods in strong trending environments.
Mean reversion strategies represent another popular application of Bollinger Bands. When price reaches the outer bands, especially the upper band in ranging markets, it often reverts toward the middle band (the moving average). This tendency occurs because extreme moves away from the average price are typically unsustainable in the short term. However, traders must be cautious during trending markets, as price can remain at or beyond the bands for extended periods.
The percentage of price action occurring within the bands provides valuable insight into market behavior. Typically, about 95% of price action occurs within the bands, making moves beyond the bands statistically significant. When price closes outside the bands, it often signals either a continuation of a strong trend or an overextended move that may reverse.
Bollinger Bands work exceptionally well when combined with other indicators. Many traders use RSI alongside Bollinger Bands to confirm reversal signals. For example, when price hits the upper Bollinger Band while RSI shows overbought conditions (above 70), it creates a higher-probability reversal setup. Similarly, touches of the lower band combined with oversold RSI readings can signal potential buying opportunities.
Fibonacci Retracement: The Mathematical Magic of Market Psychology
Fibonacci retracement levels represent one of the most fascinating aspects of technical analysis, blending mathematical precision with market psychology. Based on the Fibonacci sequence discovered by Leonardo Fibonacci in the 13th century, these levels identify potential support and resistance areas where price reversals are likely to occur.

The key Fibonacci retracement levels used in forex trading are 23.6%, 38.2%, 50%, 61.8%, and 78.6%. While the 50% level isn’t technically a Fibonacci ratio, it’s included because of its psychological significance—markets often retrace exactly half of their previous moves. The 61.8% level, known as the “golden ratio,” holds particular importance as it represents the most common retracement level in financial markets.
Drawing Fibonacci retracements correctly is crucial for their effectiveness. The tool should be drawn from a significant swing low to a swing high in uptrends, or from swing high to swing low in downtrends. The key word here is “significant”—minor fluctuations won’t produce meaningful Fibonacci levels. Traders should focus on obvious, well-defined swings that represent meaningful market moves.
The power of Fibonacci levels lies partly in their self-fulfilling nature. Because so many traders watch these levels, they often become significant support and resistance points simply because market participants expect them to be. When price approaches a key Fibonacci level, buyers or sellers often step in, creating the very support or resistance that traders anticipated.
Fibonacci retracements work best when combined with other technical analysis tools. When a Fibonacci level coincides with a moving average, trend line, or previous support/resistance level, it creates what traders call “confluence.” These confluence areas represent higher-probability zones where price reactions are more likely to occur.
The 38.2% and 61.8% retracement levels deserve special attention. The 38.2% level often represents shallow retracements in strong trends, while the 61.8% level typically marks deeper corrections. When price retraces to the 38.2% level and finds support or resistance, it suggests a strong underlying trend. Retracements to the 61.8% level often indicate more significant corrections but can also provide excellent entry points for trend continuation trades.
Extensions beyond the 78.6% level often signal trend reversals rather than corrections. When price breaks below a 78.6% retracement level (in an uptrend), it frequently indicates that the previous trend has ended and a new trend in the opposite direction may be beginning.
Stochastic Oscillator: Capturing Momentum Extremes
The Stochastic Oscillator, developed by George Lane in the 1950s, provides another powerful tool for analyzing momentum and identifying potential reversal points. This indicator compares a currency pair’s closing price to its price range over a specific period, typically 14 periods, generating values that oscillate between 0 and 100.
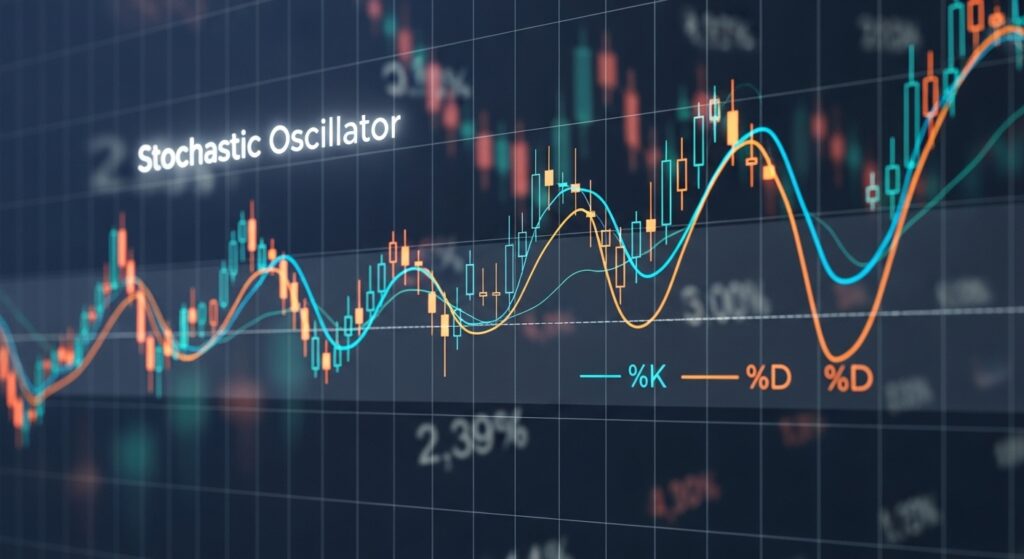
The Stochastic consists of two lines: %K (the main line) and %D (the signal line). The %K line represents the current closing price’s position within the recent trading range, while the %D line is a smoothed version of %K, typically calculated as a 3-period moving average. The interaction between these two lines generates the primary trading signals.
Traditional Stochastic signals occur at extreme levels. Readings above 80 indicate overbought conditions, suggesting potential selling opportunities, while readings below 20 suggest oversold conditions and possible buying opportunities. However, like all oscillators, these levels should be interpreted within the broader market context rather than as absolute triggers.
The most reliable Stochastic signals often come from divergences between the oscillator and price action. Bullish divergence occurs when price makes lower lows while the Stochastic makes higher lows, suggesting that downward momentum is weakening. Bearish divergence presents when price reaches higher highs while the Stochastic fails to confirm, indicating potential upward momentum exhaustion.
Stochastic crossovers provide another layer of analysis. When the %K line crosses above the %D line, it generates a bullish signal, suggesting upward momentum is building. Conversely, when %K crosses below %D, it creates a bearish signal. These crossover signals are most reliable when they occur at extreme levels—bullish crossovers below 20 or bearish crossovers above 80.
The Stochastic Oscillator performs exceptionally well in range-bound markets where prices oscillate between defined support and resistance levels. In these environments, the oscillator’s ability to identify overbought and oversold conditions provides valuable timing for entries and exits. However, during strong trending markets, the Stochastic can remain at extreme levels for extended periods, generating multiple false signals.
Many professional traders adjust their Stochastic interpretation based on market conditions. In trending markets, they might use more extreme levels (90/10 instead of 80/20) or focus primarily on divergence signals rather than level-based entries. This adaptive approach helps reduce false signals and improves the indicator’s overall effectiveness.
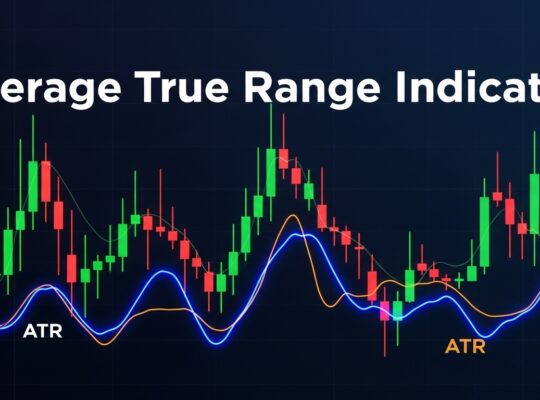
Average True Range: The Volatility Measurement Tool
The Average True Range (ATR), developed by J. Welles Wilder, represents one of the most important yet underutilized indicators in forex trading. Unlike other indicators that focus on price direction, ATR measures volatility—the degree of price movement regardless of direction. This unique characteristic makes ATR invaluable for risk management and position sizing decisions.
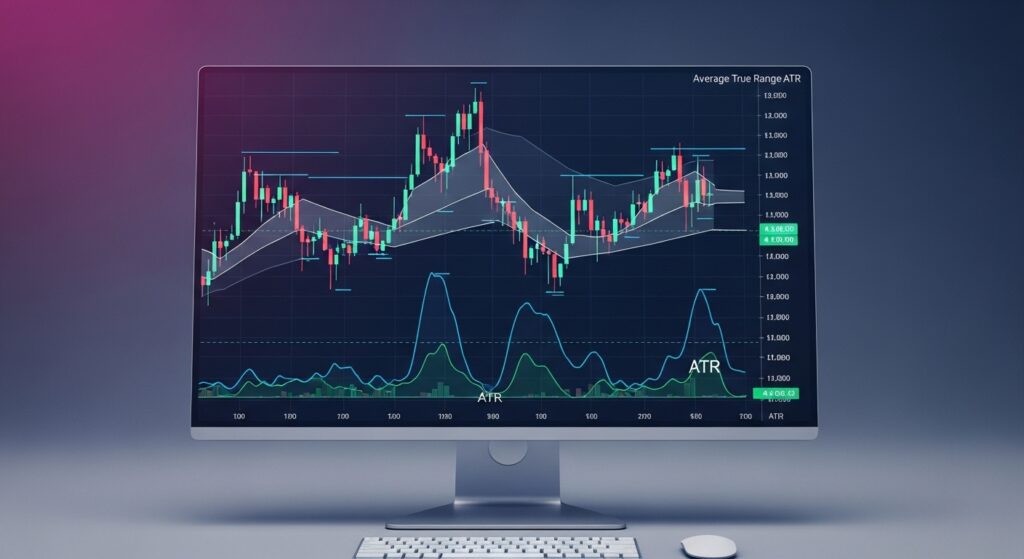
ATR calculates the average of true ranges over a specified period, typically 14 periods. The true range represents the greatest of three values: the current high minus the current low, the absolute value of the current high minus the previous close, or the absolute value of the current low minus the previous close. This calculation ensures that gaps between periods are properly accounted for in the volatility measurement.
The primary application of ATR lies in stop-loss placement. Rather than using arbitrary pip amounts, traders can set stops based on current market volatility. For example, setting a stop at 2 times the current ATR provides a buffer that accounts for normal market fluctuations while still protecting against significant adverse moves. This approach adapts to changing market conditions—wider stops during volatile periods and tighter stops during calm markets.
ATR also proves invaluable for position sizing. By understanding current volatility levels, traders can adjust their position sizes to maintain consistent risk levels across different market conditions. Higher ATR values suggest increased volatility and may warrant smaller position sizes to maintain the same dollar risk per trade. Lower ATR readings indicate calmer markets where slightly larger positions might be appropriate.
Market regime identification represents another powerful ATR application. Rising ATR values often coincide with the beginning of new trends or significant market moves, as increased volatility typically accompanies important market developments. Falling ATR readings may signal trend exhaustion or the development of range-bound conditions.
ATR values should always be interpreted in relative terms rather than absolute numbers. An ATR of 100 pips might be normal for GBP/JPY but extremely high for EUR/CHF. Traders should focus on ATR’s direction and relative levels compared to recent history rather than the absolute values.
Professional traders often use ATR in conjunction with other indicators to create comprehensive trading systems. For example, they might use moving averages for trend direction, RSI for entry timing, and ATR for stop placement and position sizing. This multi-faceted approach addresses all aspects of trade management while maintaining focus on current market conditions.
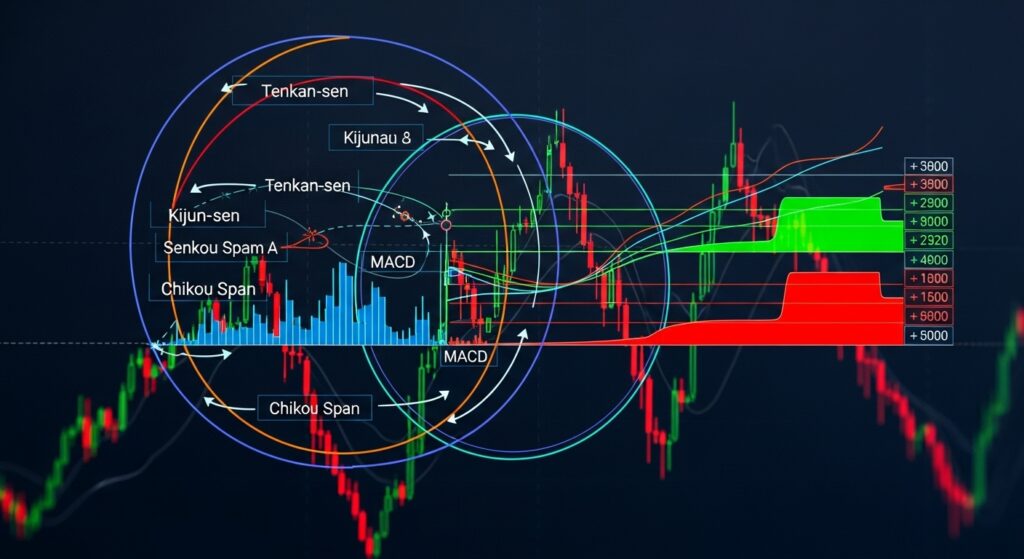
Ichimoku Cloud: The Complete Trading System
The Ichimoku Kinko Hyo, commonly called the Ichimoku Cloud, represents perhaps the most comprehensive single indicator system available to forex traders. Developed by Japanese journalist Goichi Hosoda in the late 1960s, this indicator provides information about trend direction, momentum, support and resistance levels, and even future price targets—all within one elegant system.
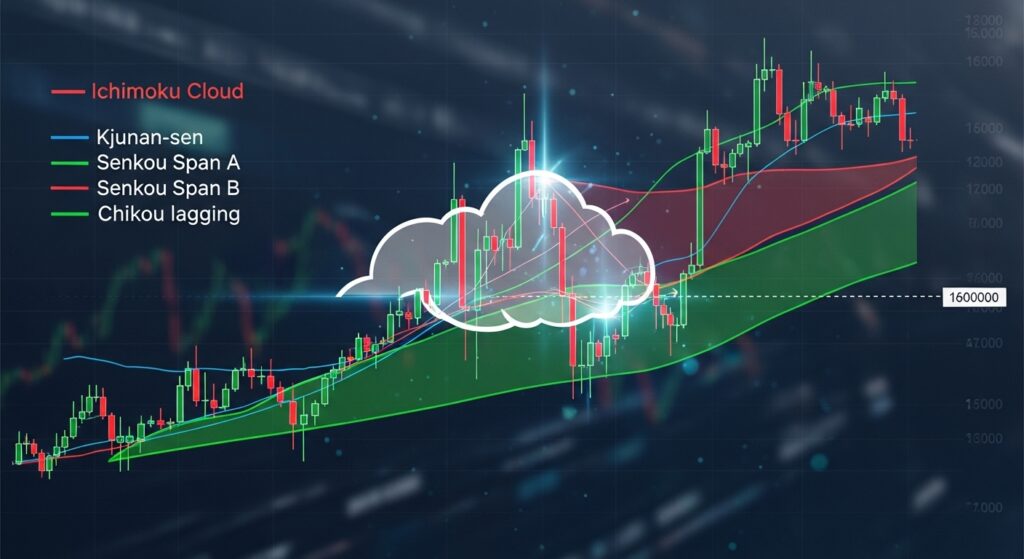
The Ichimoku Cloud consists of five main components: Tenkan-sen (conversion line), Kijun-sen (base line), Senkou Span A, Senkou Span B, and Chikou Span (lagging span). Each element provides specific information about market conditions and potential trading opportunities. The “cloud” itself is formed by the area between Senkou Span A and Senkou Span B, projected into the future.
The cloud serves multiple functions in market analysis. When price trades above the cloud, it indicates bullish conditions, while price below the cloud suggests bearish sentiment. The cloud itself acts as dynamic support during uptrends and resistance during downtrends. The thickness of the cloud provides information about the strength of these levels—thicker clouds represent stronger support or resistance.
Cloud color changes provide important trend signals. When Senkou Span A is above Senkou Span B, the cloud typically appears green (or white), indicating bullish conditions. When Senkou Span B rises above Senkou Span A, the cloud turns red (or hatched), suggesting bearish sentiment. These color changes often precede or confirm significant trend reversals.
The interaction between price and the various Ichimoku components generates multiple trading signals. Tenkan-sen and Kijun-sen crossovers provide momentum signals similar to moving average crossovers. When the Tenkan-sen crosses above the Kijun-sen, it generates a bullish signal, while crosses below create bearish signals. These signals are most reliable when they occur in alignment with the overall cloud direction.
The Chikou Span (lagging span) provides confirmation signals by comparing current price to historical levels. When the Chikou Span is above the price from 26 periods ago, it confirms bullish conditions. Conversely, when it’s below historical price levels, it suggests bearish momentum. Many traders wait for Chikou Span confirmation before entering trades based on other Ichimoku signals.
One of Ichimoku’s most powerful features is its ability to project support and resistance levels into the future. The cloud extends ahead of current price action, providing traders with advance warning of potential turning points. This forward-looking capability is unique among technical indicators and gives traders a significant advantage in planning future trades.
Despite its complexity, Ichimoku works best when kept simple. Beginning traders should focus on the basic cloud signals—trading above the cloud for bullish bias and below the cloud for bearish bias. As experience grows, additional components can be incorporated for more sophisticated analysis and confirmation.
Support and Resistance: The Foundation of Price Action
Support and resistance levels represent the bedrock of technical analysis, forming the foundation upon which most other analytical techniques are built. These levels identify price areas where buying or selling pressure has historically been significant enough to halt or reverse price movements. Understanding support and resistance is crucial for effective forex trading, as these levels often determine the success or failure of trading strategies.
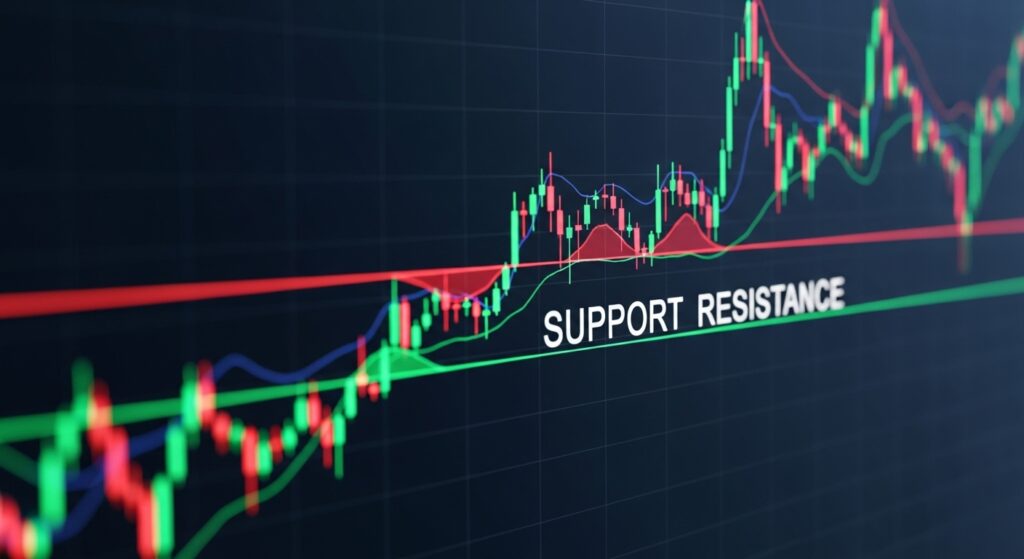
Support levels represent price areas where buying interest has previously emerged, preventing further declines. These levels form when demand exceeds supply, creating a floor under the market. Resistance levels occur where selling pressure has historically overwhelmed buying interest, creating a ceiling that prevents further advances. The psychological aspect of these levels cannot be overstated—traders remember previous turning points and often expect similar reactions at the same levels.
Horizontal support and resistance levels are the most basic and often most reliable. These occur at specific price points where significant reversals have happened in the past. Round numbers often serve as psychological support and resistance levels, as traders naturally gravitate toward these clean price points. For example, 1.2000 in EUR/USD or 110.00 in USD/JPY frequently act as significant levels due to their psychological importance.
Dynamic support and resistance add another dimension to level analysis. Moving averages, trend lines, and channel boundaries all serve as dynamic levels that change over time. These levels adapt to current market conditions, often providing more relevant support and resistance than static horizontal levels. The 200-period moving average, in particular, serves as a widely watched dynamic level across all major currency pairs.
The strength of support and resistance levels depends on several factors. The number of times a level has been tested increases its significance—levels that have held multiple times are more likely to hold again. The volume of trading activity at a level also influences its strength, though volume data is limited in spot forex markets. The time frame on which a level forms matters too—levels from daily or weekly charts typically carry more weight than those from shorter time frames.
When support or resistance levels are broken, they often reverse roles. A broken support level frequently becomes resistance on subsequent rallies, while broken resistance often provides support on future declines. This role reversal occurs because traders who missed the initial breakout often wait for price to return to the broken level for a second chance to enter the trade.
The concept of confluence applies strongly to support and resistance analysis. When multiple types of support or resistance align at similar price levels, they create zones of heightened significance. For example, a horizontal resistance level that coincides with a downward trend line and the 61.8% Fibonacci retracement creates a powerful confluence zone where reversal is highly probable.
Volume Indicators: Confirming Price Movements
Volume analysis in forex trading presents unique challenges compared to stock or futures markets, as the decentralized nature of forex means that true volume data isn’t readily available to retail traders. However, tick volume and volume-based indicators can still provide valuable insights into market sentiment and help confirm price movements.
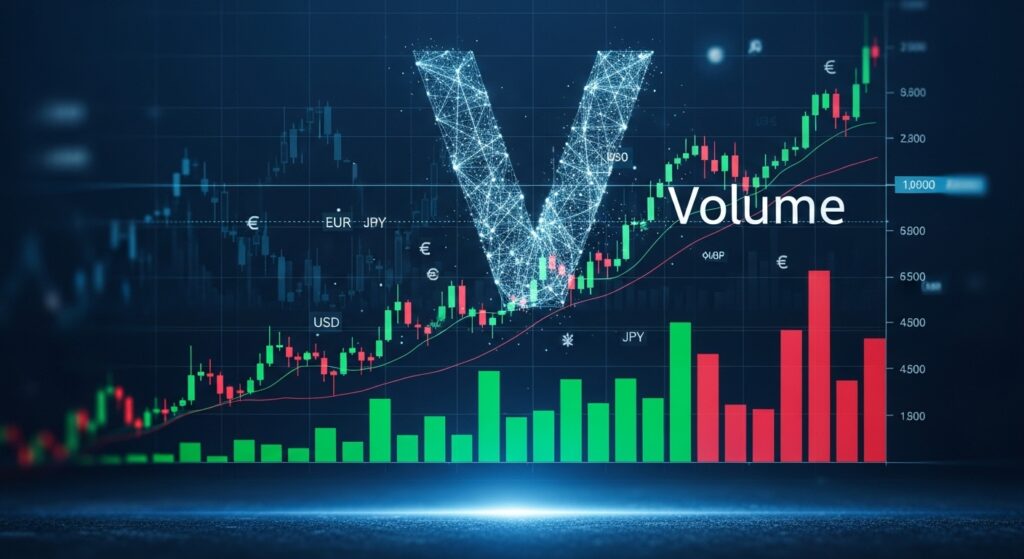
On-Balance Volume (OBV) represents one of the most useful volume indicators for forex traders. OBV adds volume on up days and subtracts volume on down days, creating a running total that shows whether volume is flowing into or out of a currency pair. Rising OBV suggests accumulation (buying pressure), while falling OBV indicates distribution (selling pressure). The key insight comes from comparing OBV trends with price trends—confirming signals occur when both move in the same direction, while divergences may signal potential reversals.
The Volume Weighted Average Price (VWAP) provides another valuable perspective on market activity. VWAP calculates the average price at which a currency pair has traded, weighted by volume. This indicator is particularly useful for identifying fair value and determining whether current prices represent good value relative to the day’s trading activity. When price trades above VWAP, it suggests bullish sentiment, while trading below VWAP indicates bearish conditions.
Money Flow Index (MFI) combines price and volume data to create an oscillator similar to RSI but with volume weighting. MFI oscillates between 0 and 100, with readings above 80 suggesting overbought conditions and readings below 20 indicating oversold levels. The volume component makes MFI particularly effective at identifying divergences, as volume often leads price in market reversals.
Volume confirmation plays a crucial role in breakout trading. Genuine breakouts from support, resistance, or chart patterns typically occur with expanding volume, indicating broad market participation in the move. False breakouts, on the other hand, often happen on declining volume, suggesting lack of conviction behind the price movement. This volume analysis helps traders distinguish between legitimate breakouts and false signals that are likely to reverse.
The limitations of volume analysis in forex should be acknowledged. Since retail forex traders typically see tick volume rather than actual transaction volume, the data provides an approximation rather than precise measurement of trading activity. Additionally, the global, 24-hour nature of forex markets means that volume patterns may vary significantly across different trading sessions.
Despite these limitations, volume indicators remain valuable tools for confirmation and divergence analysis. They work best when combined with price-based indicators and should never be used in isolation for trading decisions. The key is understanding that volume indicators provide additional context rather than standalone trading signals.
Choosing the Right Indicators for Your Trading Style
Selecting appropriate forex indicators requires careful consideration of your trading style, time commitment, and market approach. Different trading approaches demand different analytical tools, and understanding these requirements is crucial for developing an effective trading system. The goal isn’t to find the “perfect” indicator but rather to identify tools that complement your natural trading tendencies and available time.
Day traders operating on short-term charts typically benefit from responsive indicators that provide quick signals. RSI and Stochastic Oscillator work well for day trading because they identify overbought and oversold conditions that often lead to quick reversals within the trading day. MACD can also be valuable for day traders when used on shorter timeframes, providing momentum signals for intraday moves. Bollinger Bands help day traders identify volatility expansions and contractions that often precede significant intraday moves.
Swing traders holding positions for several days to weeks require indicators that filter out short-term noise while capturing medium-term trends. Moving averages become particularly valuable for swing trading, as they smooth out daily fluctuations and highlight the underlying trend direction. The combination of multiple moving averages can provide swing traders with clear trend signals and dynamic support/resistance levels. Fibonacci retracements excel in swing trading applications, helping identify logical entry points within established trends.
Position traders focusing on long-term trends need indicators that work effectively on daily and weekly charts while filtering out shorter-term market noise. Long-term moving averages (100-period and 200-period) become essential tools for position traders, clearly defining major trend directions. Monthly and weekly support and resistance levels carry more weight for position traders than shorter-term levels. The Ichimoku Cloud system can be particularly effective for position trading due to its comprehensive approach and forward-looking capabilities.
Scalpers operating on very short timeframes face unique indicator challenges. Traditional indicators often lag too much for effective scalping, making price action analysis more critical. However, ATR becomes invaluable for scalpers in determining appropriate stop-loss levels and understanding current volatility conditions. Simple moving averages on very short timeframes can help scalpers identify the immediate trend direction for their quick trades.
Risk tolerance also influences indicator selection. Conservative traders often prefer lagging indicators like moving averages that confirm trends rather than predict them. These indicators may provide fewer false signals but might miss the early stages of new trends. Aggressive traders might favor leading indicators like RSI or Stochastic that attempt to identify turning points early, accepting higher false signal rates in exchange for better entry timing.
Time availability represents another crucial factor in indicator selection. Traders with limited time to monitor markets might prefer simple, clear indicators that don’t require constant interpretation. Moving average crossovers, for example, provide clear signals that don’t require extensive analysis. Traders with more time available can employ complex systems like Ichimoku or multiple indicator combinations that require more interpretation but may provide better signal quality.
Advanced Strategies for Combining Multiple Indicators
The art of combining multiple forex indicators lies in creating synergy while avoiding redundancy. Successful multi-indicator strategies follow the principle of confirmation rather than correlation—each indicator should provide unique information that confirms or contradicts signals from other indicators. The goal is building a comprehensive picture of market conditions rather than simply collecting multiple signals that say the same thing.
The trend-momentum-volatility framework provides an excellent structure for combining indicators. This approach uses one indicator to identify trend direction, another to gauge momentum, and a third to measure volatility. For example, a 50-period moving average might define the trend, RSI could measure momentum, and ATR would gauge volatility. This combination ensures all major market dimensions are covered without overlap.
Three-point confirmation represents a popular approach among professional traders. This method requires signals from three different types of analysis before taking action. The confirmation might come from trend analysis (moving averages), momentum analysis (RSI or MACD), and support/resistance levels (horizontal levels or Fibonacci retracements). Only when all three elements align does the trader consider entering a position.
Multi-timeframe analysis adds another layer of sophistication to indicator combinations. This approach involves analyzing longer timeframes for trend direction and shorter timeframes for entry timing. For instance, a trader might use daily charts to identify the overall trend with moving averages, then switch to hourly charts to fine-tune entries using RSI or Stochastic signals. This method helps ensure trades align with the broader trend while optimizing entry points.
Confluence zones represent areas where multiple indicators suggest similar outcomes. These might occur when a Fibonacci retracement level coincides with a moving average and a previous support/resistance level. The more indicators that point to the same price area, the higher the probability of a significant market reaction at that level. Successful traders actively seek these confluence zones for their highest-probability setups.
The layered approach to indicator combination involves using indicators with different sensitivities and timeframes. A fast indicator like a 5-period RSI might provide early warning signals, while a slower indicator like a 21-period RSI confirms the trend. This layered approach helps traders catch trend changes early while reducing false signals through confirmation requirements.
Leading and lagging indicator combinations can be particularly effective. Leading indicators like RSI or Stochastic might identify potential reversal points, while lagging indicators like moving averages confirm the new trend direction. This combination helps traders enter near turning points while ensuring they’re trading in the direction of the confirmed trend.
Filter systems represent another advanced combination technique. In this approach, one indicator acts as a filter that determines market conditions, while others provide specific entry signals. For example, ATR might serve as a volatility filter—only taking momentum signals when volatility is above a certain threshold. This prevents trading during dead markets where false signals are common.
Common Mistakes When Using Forex Indicators
Understanding common indicator mistakes helps traders avoid costly errors and develop more effective analytical approaches. These mistakes often stem from misunderstanding indicator limitations, over-relying on signals, or failing to consider market context. Recognizing these pitfalls is essential for developing mature, profitable trading approaches.
Over-reliance on indicators represents perhaps the most common mistake among developing traders. Indicators are tools that provide information about past price movements, but they cannot predict future movements with certainty. Traders who base decisions solely on indicator signals without considering broader market context, fundamental factors, or price action often struggle with consistency. Successful trading requires balancing indicator analysis with other forms of market analysis.
Analysis paralysis occurs when traders use too many indicators simultaneously, creating confusion rather than clarity. Charts cluttered with multiple oscillators, moving averages, and other indicators often generate conflicting signals that make decision-making difficult. The key is selecting a focused set of complementary indicators rather than trying to use every available tool. Quality of analysis matters more than quantity of indicators.
Ignoring market context represents another critical error. Indicators perform differently in trending versus ranging markets, high-volatility versus low-volatility environments, and during different trading sessions. For example, oscillators like RSI work well in ranging markets but can remain at extreme levels for extended periods during strong trends. Successful traders adapt their indicator interpretation based on current market conditions.
Parameter optimization without understanding often leads to curve-fitting problems. While it’s tempting to optimize indicator settings for past performance, this approach frequently fails in real trading because market conditions change constantly. Default settings for most indicators exist because they work across various market conditions. Constant tweaking of parameters often reflects a misunderstanding of how indicators work rather than genuine improvement.
Focusing solely on entry signals while ignoring exit strategies represents a significant oversight. Many traders spend considerable time perfecting entry techniques using indicators but give little thought to when and how to exit positions. Effective indicator use requires equal attention to both entry and exit signals, as well as risk management considerations.
Misunderstanding indicator lag is another frequent problem. All indicators are based on historical data, meaning they inherently lag behind current price action. Traders expecting indicators to predict exact turning points often become frustrated when signals arrive after moves have already begun. Understanding this limitation helps set realistic expectations and encourages traders to view indicators as confirmation tools rather than prediction devices.
Failing to consider false signals represents a critical oversight in indicator usage. All indicators generate false signals—it’s an unavoidable characteristic of technical analysis. Successful traders expect false signals and build risk management systems to handle them. This includes setting appropriate stop-losses, position sizing correctly, and maintaining realistic win/loss ratios.
Adapting Indicators to Different Market Conditions
Market conditions change constantly, and effective indicator usage requires adapting analytical approaches to current environments. Understanding how different market regimes affect indicator performance helps traders maintain effectiveness across varying conditions. This adaptability separates consistently profitable traders from those who struggle when market conditions shift.

Trending markets favor indicators that follow momentum and trend direction. Moving averages perform exceptionally well during trending conditions, providing clear directional bias and dynamic support/resistance levels. MACD also excels in trending markets, as its momentum characteristics help traders stay with established moves. Bollinger Band “walks” along one band or the other often characterize strong trending periods, providing excellent trend-following signals.
During trending conditions, oscillators like RSI and Stochastic require different interpretation. Rather than using traditional overbought/oversold levels (70/30 for RSI), traders might employ more extreme levels (80/20 or even 90/10) to avoid being shaken out of profitable trends. Divergence analysis becomes particularly valuable during trending markets, as it can signal when trends are losing momentum before price action confirms the change.
Range-bound markets present different challenges and opportunities for indicator usage. Oscillators shine in ranging conditions, as their overbought and oversold signals align with price bouncing between defined levels. RSI readings above 70 often coincide with price reaching resistance levels, while readings below 30 frequently occur near support. Bollinger Bands work exceptionally well in ranging markets, with touches of the outer bands often signaling reversal opportunities.
Moving averages become less reliable during range-bound conditions, often generating multiple false crossover signals as price whips back and forth around the average. Traders might either avoid moving average signals during ranging markets or use longer-period averages that are less sensitive to minor fluctuations.
High-volatility environments require special consideration for all indicators. ATR becomes particularly valuable during volatile periods, helping traders adjust stop-losses and position sizes appropriately. Bollinger Bands automatically adjust to volatility changes, widening during volatile periods and contracting during calm markets. This adaptive quality makes them especially useful for volatility-based strategies.
Low-volatility conditions often precede significant market moves, making them important periods for preparation. Bollinger Band squeezes frequently occur during low-volatility periods, alerting traders to potential breakout opportunities. Moving averages tend to converge during calm periods, setting up potential crossover signals when volatility returns.
Session-based considerations also affect indicator performance. The Asian session often exhibits ranging behavior, making oscillators more effective. The London and New York sessions frequently show trending characteristics, favoring momentum and trend-following indicators. Understanding these session characteristics helps traders select appropriate indicators for their trading times.
Economic event periods require special indicator consideration. High-impact news releases often create volatile, unpredictable price movements that can trigger false signals from all indicators. Many experienced traders reduce their reliance on technical indicators around major economic announcements, focusing instead on fundamental analysis and risk management.
Building Your Personal Indicator Toolkit
Developing an effective personal indicator toolkit requires careful consideration of individual trading preferences, market understanding, and practical experience. The goal isn’t to master every available indicator but rather to develop deep expertise with a focused set of tools that complement your trading approach and personality.

Starting with foundational indicators provides the best approach for new traders. Moving averages should form the cornerstone of any indicator toolkit due to their versatility and reliability. Begin with simple moving averages in common periods (20, 50, 200) before exploring exponential moving averages or more complex trend-following tools. Understanding how moving averages behave across different market conditions provides essential groundwork for all other indicator analysis.
Adding momentum indicators represents the next logical step in toolkit development. RSI offers an excellent introduction to oscillator analysis, providing clear overbought and oversold signals while teaching important concepts like divergence analysis. Once comfortable with RSI, traders can explore other momentum tools like Stochastic or MACD, each offering unique perspectives on market momentum.
Volatility measurement becomes increasingly important as trading skills develop. ATR should be included in every serious trader’s toolkit, not necessarily for entry signals but for risk management and position sizing decisions. Understanding current volatility conditions helps optimize stop-loss placement and position sizing across different market environments.
Support and resistance analysis, while not technically an indicator, forms an essential component of any complete analytical toolkit. Learning to identify and draw horizontal support and resistance levels, trend lines, and chart patterns provides context for all other indicator analysis. These levels often explain why indicator signals succeed or fail at specific price areas.
The progression from basic to advanced indicators should follow practical experience rather than arbitrary timelines. Traders should only add new indicators to their toolkit after thoroughly understanding their current tools. Jumping between indicators without mastering any leads to confusion and inconsistent results. Depth of understanding trumps breadth of knowledge in successful trading.
Testing and validation represent crucial steps in toolkit development. Before committing real money to any indicator-based strategy, traders should conduct thorough backtesting and forward testing. This process reveals how indicators perform across different market conditions and helps identify optimal settings and combinations. Paper trading or demo account testing provides valuable experience without financial risk.
Documentation and review processes help optimize indicator usage over time. Keeping detailed records of trades, including which indicators prompted entries and exits, helps identify patterns in personal trading performance. This analysis often reveals which indicators work best for individual trading styles and market conditions.
Regular toolkit review ensures continued effectiveness as markets evolve and personal trading skills develop. What works for beginning traders may need adjustment as experience grows. Market conditions also change over time, potentially requiring modifications to indicator usage or interpretation.
Practical Implementation and Setup Guidelines
Successfully implementing forex indicators requires attention to platform setup, chart configuration, and systematic approaches to analysis. The technical aspects of indicator implementation often determine whether analytical insights translate into practical trading success. Proper setup and organization create the foundation for consistent, effective indicator usage.

Chart organization plays a crucial role in effective indicator implementation. Clean, uncluttered charts improve decision-making by reducing visual noise and highlighting important signals. Limit the number of indicators displayed simultaneously—typically no more than three or four indicators should appear on any single chart. Use separate indicator windows when possible to avoid overlapping displays that can obscure important information.
Color schemes and visual settings significantly impact chart readability and analysis effectiveness. Choose contrasting colors that remain visible across different lighting conditions and device screens. Consistency in color usage helps develop pattern recognition—always use the same color for similar indicators across different charts and timeframes. Many successful traders develop personal color schemes that enhance their analytical process.
Template creation streamlines the setup process and ensures consistency across different currency pairs and timeframes. Most trading platforms allow saving chart configurations as templates, eliminating the need to recreate setups repeatedly. Develop separate templates for different analysis purposes—trend analysis, momentum analysis, or multi-timeframe analysis—to quickly access appropriate configurations.
Multi-monitor setups can significantly enhance indicator-based analysis, though they’re not necessary for success. Traders with multiple monitors can dedicate screens to different timeframes or analysis types. A common approach involves using one monitor for longer-timeframe trend analysis and another for shorter-timeframe entry timing. Single-monitor traders can achieve similar benefits through effective use of tab organization and chart switching.
Mobile platform considerations become increasingly important as traders seek flexibility in market monitoring. Most mobile trading platforms offer basic indicator functionality, though with limitations compared to desktop versions. Focus on the most essential indicators for mobile trading—typically moving averages, RSI, and support/resistance levels provide sufficient analysis capability for mobile monitoring.
Alert systems help traders monitor indicator signals without constant chart watching. Most platforms offer alert functionality for various indicator conditions—crossovers, level breaches, or divergence formations. Properly configured alerts allow traders to respond to opportunities while maintaining normal daily activities. However, alerts should supplement rather than replace regular market analysis.
Platform-specific considerations affect indicator implementation across different trading software. MetaTrader 4 and 5 offer extensive indicator libraries and customization options but may require additional plugins for advanced functionality. TradingView provides powerful charting capabilities with extensive indicator selections but primarily serves analysis rather than execution. Commercial trading platforms often offer integrated indicator and execution capabilities but may have limited customization options.
Data feed quality affects all indicator calculations, making reliable data sources essential for accurate analysis. Most reputable brokers provide sufficient data quality for retail trading, but traders should verify that their chosen platform offers clean, accurate price data. Historical data availability becomes important for backtesting and longer-term analysis.
Regular platform maintenance ensures optimal indicator performance over time. This includes keeping software updated, monitoring data feed quality, and periodically reviewing indicator settings. Platform crashes or data feed interruptions can affect indicator calculations, potentially leading to incorrect signals if not identified and corrected promptly.
Conclusion
The journey through the world’s most effective forex indicators reveals a fundamental truth: successful trading isn’t about finding the perfect indicator, but rather about understanding how to use proven tools effectively within your personal trading approach. Each indicator we’ve explored—from the foundational moving averages to the comprehensive Ichimoku system—offers unique insights into market behavior when properly understood and applied.
The moving average teaches us about trend direction and provides dynamic support and resistance levels that adapt to changing market conditions. RSI reveals momentum extremes and powerful divergence patterns that often precede significant market turns. MACD combines trend and momentum analysis in a versatile tool that works across multiple timeframes and market conditions. Bollinger Bands help us understand volatility and mean reversion tendencies that characterize different market phases.
The sophisticated concepts of Fibonacci retracements show us how mathematical relationships appear in market psychology, while the Stochastic Oscillator provides another perspective on momentum extremes. ATR becomes our volatility compass, guiding risk management decisions and helping us adapt to changing market conditions. The Ichimoku Cloud offers a complete trading philosophy wrapped in a single, comprehensive indicator system.
Perhaps most importantly, we’ve learned that the effectiveness of any indicator depends heavily on context—understanding current market conditions, adapting our interpretation accordingly, and avoiding the common pitfalls that trap inexperienced traders. The best forex indicators are those that complement your trading style, risk tolerance, and time availability while providing clear, actionable insights into market behavior.
Remember that indicators are tools, not crystal balls. They provide information about past price movements and current market conditions, but they cannot guarantee future performance. The most successful traders combine indicator analysis with sound risk management, proper position sizing, and a deep understanding of market fundamentals.
Your journey toward indicator mastery begins with selecting two or three complementary tools from this guide and dedicating time to truly understand their behavior across different market conditions. Master the basics before adding complexity, and always remember that consistent profitability comes from disciplined application of proven principles rather than the pursuit of perfect signals.
Start with demo trading to test your indicator knowledge without risking real capital. As your understanding deepens and your confidence grows, gradually transition to live trading with proper risk management protocols in place. The path to forex trading success is built one well-executed trade at a time, guided by the reliable insights that these time-tested indicators provide.
Frequently Asked Questions
What is the most accurate forex indicator for beginners?
For beginners, moving averages represent the most reliable and accurate starting point in forex indicator analysis. The 20-period and 50-period simple moving averages provide clear trend identification and dynamic support/resistance levels that are easy to understand and interpret. Moving averages work consistently across all major currency pairs and timeframes, making them ideal for developing foundational technical analysis skills. They’re less prone to false signals compared to oscillators and help new traders understand the basic concept of trend following, which forms the backbone of many successful trading strategies.
How many forex indicators should I use simultaneously?
The optimal number of forex indicators to use simultaneously is typically two to three, focusing on complementary rather than redundant analysis. Using more than four indicators often leads to analysis paralysis and conflicting signals that make decision-making difficult. The key is selecting indicators that provide different types of information—for example, combining a trend indicator (moving average), a momentum indicator (RSI), and a volatility measure (ATR). This approach ensures comprehensive market analysis without overwhelming complexity. Many professional traders succeed with even fewer indicators, emphasizing deep understanding over breadth of tools.
Do forex indicators work in all market conditions?
No single forex indicator works optimally in all market conditions, which is why understanding market context is crucial for effective indicator usage. Trend-following indicators like moving averages excel during directional markets but generate false signals in ranging conditions. Oscillators like RSI and Stochastic work well in range-bound markets but can remain at extreme levels during strong trends. Successful traders adapt their indicator interpretation based on current market conditions—using different signals or sensitivity levels depending on whether markets are trending, ranging, volatile, or calm. This adaptability separates consistently profitable traders from those who struggle when conditions change.
Can I rely solely on free indicators for profitable forex trading?
Absolutely—free indicators available on standard trading platforms are completely sufficient for profitable forex trading. The classic indicators covered in this guide (moving averages, RSI, MACD, Bollinger Bands) have been used successfully by professional traders for decades and remain as effective today as when they were first developed. Expensive or complex indicators don’t necessarily provide better results; in fact, they often add unnecessary complexity without improving performance. Success in forex trading comes from understanding and properly applying proven tools rather than seeking exotic or expensive alternatives. Focus on mastering free indicators before considering any paid alternatives.
How do I know if my forex indicator signals are reliable?
Reliable forex indicator signals typically exhibit several characteristics: they align with the overall trend direction, occur at significant support or resistance levels, show confirmation from multiple timeframes, and demonstrate confluence with other technical analysis tools. Volume confirmation (where available) adds credibility to signals, as does the broader market context surrounding the signal. Reliable signals also tend to develop gradually rather than appearing suddenly, and they often coincide with fundamental factors supporting the directional bias. The most reliable approach involves waiting for multiple confirmations rather than acting on single indicator signals, and always using proper risk management regardless of signal strength.