The Bollinger Bands have become one of the most widely used technical analysis tools in forex trading. Whether you’re a seasoned professional or just starting your trading journey, understanding how to read and interpret these bands can give you a significant edge in the markets. In the next few minutes, you’ll discover exactly how to harness the power of this versatile indicator to improve your trading decisions.
What Are Bollinger Bands and Why Do Forex Traders Swear By Them?
At its core, Bollinger Bands is a volatility indicator consisting of three distinct lines that wrap around price action like a dynamic envelope. Think of it as a smart channel that automatically adjusts to market conditions, expanding during volatile periods and contracting when the market consolidates.
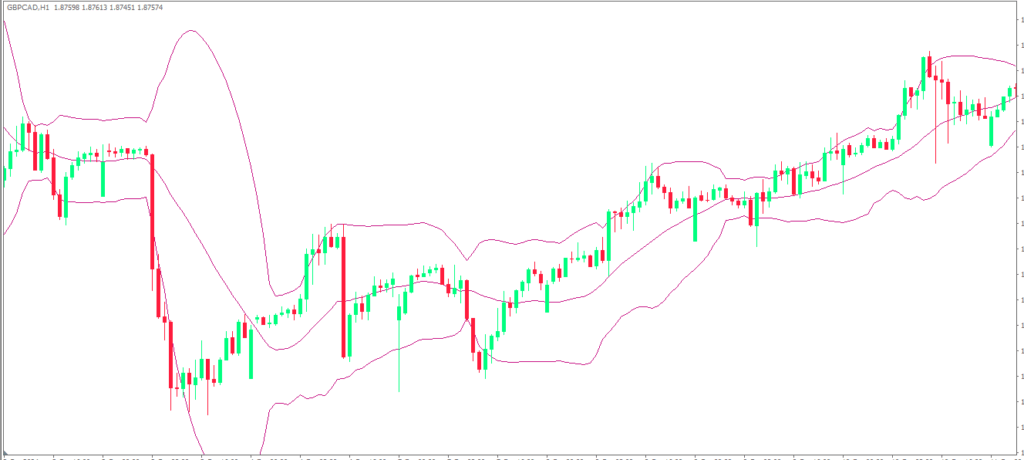
The middle band represents a 20-period simple moving average, which acts as the baseline for price movement. The upper and lower bands are calculated by adding and subtracting two standard deviations from this moving average. This mathematical approach means the bands automatically widen when volatility increases and narrow when the market becomes quiet – essentially creating a visual representation of market sentiment and momentum.
What makes Bollinger Bands particularly valuable for forex traders is their ability to adapt to different market conditions. Unlike static support and resistance levels, these bands breathe with the market, providing dynamic reference points that reflect current volatility conditions. Professional traders often describe Bollinger Bands as having a “rubber band effect” – when price stretches to touch the outer bands, it tends to snap back toward the center, creating trading opportunities.
The beauty of this indicator lies in its simplicity. You don’t need complex calculations or multiple screens filled with indicators. Three lines on your chart can tell you whether the market is trending, ranging, or preparing for a significant move. This makes Bollinger Bands an ideal tool for both scalpers looking for quick entries and swing traders seeking longer-term positions.
How to Read Bollinger Bands Like a Market Wizard
Understanding Bollinger Bands isn’t just about knowing what the lines represent – it’s about recognizing the stories they tell about market psychology and price behavior. Each configuration of the bands reveals different market conditions and potential trading opportunities.
When the bands are wide apart, you’re witnessing high volatility. This often occurs during major economic announcements, geopolitical events, or when a currency pair breaks out of a consolidation pattern. During these periods, price movements tend to be more dramatic, offering both greater profit potential and increased risk. Smart traders adjust their position sizes accordingly and prepare for swift directional moves.
Conversely, when the bands squeeze together, forming what traders call a “Bollinger Band squeeze,” you’re looking at a period of low volatility. These quiet moments often precede explosive moves, much like the calm before a storm. Experienced forex traders know that tight bands are not a time for complacency but rather a signal to prepare for the next significant price movement.
The relationship between price and the bands also reveals crucial information about market momentum. When price consistently hugs the upper band, it suggests strong bullish momentum – what traders call “walking the upper band.” This pattern often continues longer than novice traders expect, as they mistakenly assume price will immediately reverse when touching the band. Similarly, when price walks along the lower band, it indicates sustained bearish pressure.
Perhaps most importantly, Bollinger Bands help identify market extremes. When price touches or exceeds the outer bands, it signals that the market may be overextended. However, this doesn’t automatically mean an immediate reversal is coming. In trending markets, price can remain at extreme levels for extended periods, which is why successful traders combine Bollinger Bands with other confirmation signals.
Three Proven Bollinger Bands Trading Strategies That Actually Work
The Bollinger Bounce strategy represents the most fundamental approach to trading these bands and works exceptionally well in ranging markets. This strategy operates on the principle that price tends to return to the middle band after touching the extremes. When price reaches the lower band in a sideways market, traders look for buying opportunities, expecting price to bounce back toward the center. Conversely, when price hits the upper band, it often provides selling opportunities.
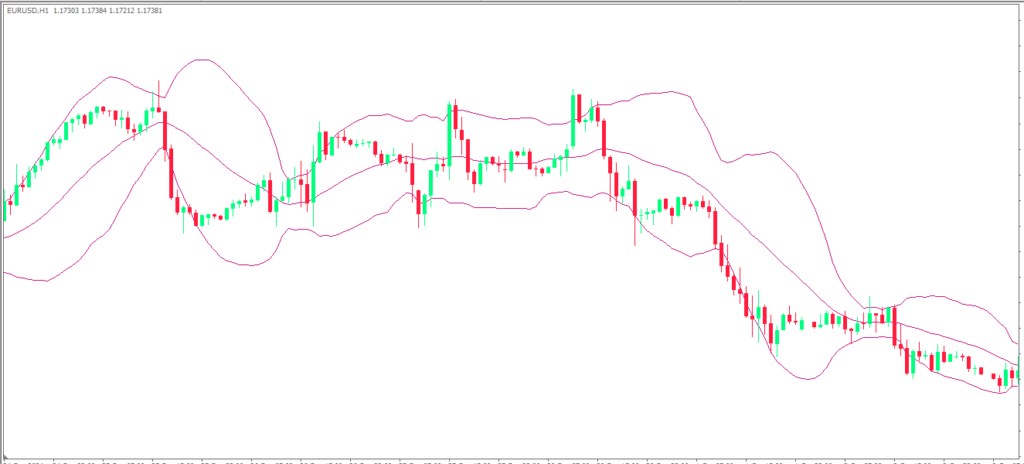
The key to success with the Bollinger Bounce is recognizing the right market environment. This strategy performs best when the overall trend is neutral, and price has been oscillating between the bands for several periods. A classic example might be the EUR/USD pair during quiet summer trading sessions, where economic news is limited, and institutional trading volumes are lower. During such periods, price often behaves like a ball bouncing between walls, creating predictable reversal points at the band extremes.
The Bollinger Band Squeeze strategy targets explosive breakout moves that follow periods of low volatility. When the bands contract significantly, creating a tight channel around price, it indicates that volatility has dropped to unusually low levels. This compression often precedes major directional moves, as markets rarely remain quiet indefinitely. Traders using this strategy position themselves to capitalize on the eventual breakout, regardless of direction.
Identifying a proper squeeze requires patience and careful observation. The bands should be at their narrowest point in recent history, and price should be consolidating within a relatively small range. Many successful forex traders combine the squeeze strategy with upcoming economic events, knowing that high-impact news releases often trigger the breakouts they’re waiting for. For instance, before major central bank announcements or employment data releases, currency pairs frequently enter squeeze patterns as traders await directional catalysts.
The Band Walking strategy recognizes that in strong trending markets, price doesn’t simply bounce off the bands but instead moves along them for extended periods. When a currency pair enters a robust uptrend, price often closes near or above the upper Bollinger Band for consecutive periods, indicating sustained buying pressure. This phenomenon challenges the common misconception that touching a band signals an immediate reversal.
Professional traders who master band walking often capture substantial moves that others miss. They understand that in trending markets, the bands act more like moving targets than fixed barriers. The strategy involves entering positions in the direction of the trend when price demonstrates the ability to maintain contact with the outer band, then managing the position as long as the walking pattern continues.
Common Bollinger Bands Mistakes That Sabotage Trading Success
One of the most destructive mistakes forex traders make is treating Bollinger Bands as absolute support and resistance levels. This oversimplification leads to premature entries and unnecessary losses. The bands are probabilistic indicators, not guaranteed turning points. Price can and often does break through the bands, especially during trending markets or high-impact news events.
Many traders also fall into the trap of using Bollinger Bands in isolation, without considering broader market context or additional confirmation signals. While the bands provide valuable information about volatility and potential reversal zones, they become significantly more powerful when combined with momentum oscillators like RSI or MACD. This multi-indicator approach helps filter false signals and increases the probability of successful trades.
Another critical error involves misunderstanding timeframes and their impact on band behavior. What appears as a squeeze on a 15-minute chart might look completely different on a 4-hour chart. Successful traders align their Bollinger Bands analysis with their intended holding period and overall trading strategy. Scalpers might focus on shorter timeframes, while position traders rely on daily or weekly band configurations.
The temptation to over-trade Bollinger Bands signals represents perhaps the most expensive mistake traders make. Not every touch of the bands creates a trading opportunity, and not every squeeze leads to a profitable breakout. Patience and selectivity separate profitable traders from those who constantly struggle. The best Bollinger Bands trades often require waiting for the perfect setup rather than forcing trades based on marginal signals.
Best Practices for Maximizing Bollinger Bands Effectiveness
The standard Bollinger Bands settings of 20 periods and 2 standard deviations work well for most forex trading situations, but understanding when and how to adjust these parameters can enhance your results. In highly volatile currency pairs or during news-heavy periods, increasing the standard deviation to 2.5 might reduce false signals. Conversely, in quieter markets, reducing it to 1.5 could provide more sensitive readings.
Combining Bollinger Bands with complementary indicators creates a more robust trading system. The Relative Strength Index works particularly well, as it helps identify overbought and oversold conditions that align with band extremes. When price touches the lower Bollinger Band while RSI shows oversold readings below 30, it often creates high-probability reversal setups. Similarly, upper band touches combined with RSI readings above 70 frequently signal potential selling opportunities.
Risk management becomes crucial when trading Bollinger Bands, as the indicator doesn’t provide specific stop-loss levels. Many successful traders place their stops beyond the opposite band, giving their trades room to breathe while maintaining reasonable risk-reward ratios. For example, when buying at the lower band, placing a stop loss slightly below it protects against continued downward movement while allowing for normal price fluctuation.
Regular backtesting and forward testing help refine your Bollinger Bands approach for different currency pairs and market conditions. What works for EUR/USD might not be optimal for GBP/JPY due to different volatility characteristics and trading patterns. Maintaining detailed trading records allows you to identify which setups perform best and adjust your strategy accordingly.
Conclusion
Bollinger Bands offer forex traders a versatile and powerful tool for reading market volatility and identifying high-probability trading opportunities. From the reliable reversal signals of the Bollinger Bounce to the explosive potential of squeeze breakouts, these three simple lines can significantly enhance your market analysis and decision-making process.
Remember that mastery comes through practice and patience. Start by observing how Bollinger Bands behave across different currency pairs and timeframes. Notice how the bands expand and contract with market volatility, and pay attention to how price interacts with these dynamic levels. Most importantly, always combine Bollinger Bands analysis with sound risk management and additional confirmation signals.
The markets will always present new challenges and opportunities. By understanding and applying these Bollinger Bands concepts, you’re building a foundation for more informed and potentially profitable trading decisions. Take the time to practice these strategies in a demo environment before risking real capital, and remember that consistent profitability comes from disciplined execution rather than perfect predictions.
What’s your experience with Bollinger Bands? Have you discovered any unique patterns or setups that work particularly well in your trading? Share your insights in the comments below, and don’t forget to bookmark this guide for future reference as you continue developing your forex trading skills.
Frequently Asked Questions
What are the best timeframes to use Bollinger Bands for forex trading?
Bollinger Bands work effectively across all timeframes, but the choice depends on your trading style. Day traders often use 15-minute to 1-hour charts for quick setups, while swing traders prefer 4-hour to daily charts for broader market analysis. The key is maintaining consistency between your analysis timeframe and trading approach.
How do I know when a Bollinger Band squeeze will lead to a breakout?
While no indicator guarantees future movement, genuine squeezes typically occur when the bands reach their narrowest point in 20-50 periods and price consolidates in a tight range. High-impact economic events or technical pattern completions often trigger the eventual breakout. Volume expansion usually accompanies legitimate breakouts.
Can Bollinger Bands work in trending markets?
Absolutely. In trending markets, focus on the band walking strategy rather than bounce trades. Strong trends often see price consistently close near or beyond one band, indicating sustained momentum. The middle band often acts as dynamic support in uptrends and resistance in downtrends.
Should I modify the standard 20-period and 2 standard deviation settings?
The standard settings work well for most situations, but adjustments can be beneficial. Shorter periods (10-15) provide more sensitive signals but increase false signals. Longer periods (30-50) offer smoother signals with less noise. Similarly, increasing standard deviations to 2.5 reduces sensitivity, while 1.5 increases it.
What’s the biggest mistake new traders make with Bollinger Bands?
The most common error is assuming that touching a band always signals an immediate reversal. This leads to premature entries and losses, especially in trending markets. Remember that bands represent areas of probability, not certainty. Always look for additional confirmation before entering trades based solely on band touches.