Category Archives: latest

for latest category on trading systems

Trend Reversal Patterns for Binary Options

download (16)

Trend reversal patterns are essential indicators of the trend end and the start of a new
movement. They are formed after the price level has reached its maximum value in the
current trend. The main feature of trend reversal patterns is that they provide information
both on the possible change in the trend and the probable value of price movement.
These patterns serve to indicate to binary options traders, that the ongoing trend is about to change the course. A pattern formed during an uptrend signals a trend reversal where the price will head down soon. On the other hand a reversal chart formed during a downtrend indicates that the price will move up.
One of the key factors to recognize a chart pattern is to know where certain patterns are
most likely to occur in the prevailing trend. Patterns occurring at market tops are known
as distribution pattern, where Binary Options traders more enthusiastically sell than buy the trading instrument. Conversely, patterns occurring at market bottoms are known as accumulation patterns, where traders more actively buy than sell the trading instrument.
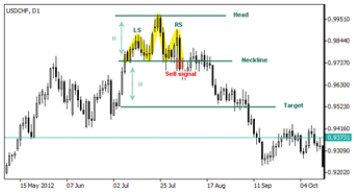
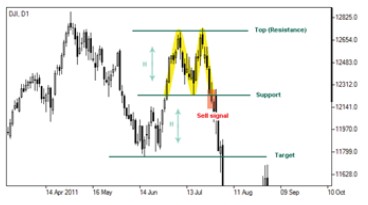
download (26)

Head and Shoulders:

Head and shoulders indicate both the end of trend and the possible change in the direction of asset’s price. The given pattern is formed in an uptrend representing three peaks of the market price arranged at different levels. Two lower peaks called shoulders are located at two sides of the highest peak called the head.
The pattern’s lows are connected by support level called a neckline. If the price falls below the neckline or support level a sell signal arises. Though prices may rebound to the neckline forming a resistance level it is expected that the decline will continue.

head shoulders

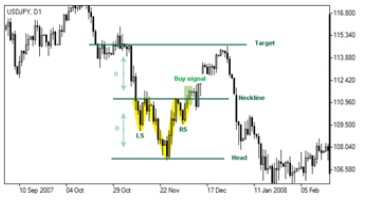
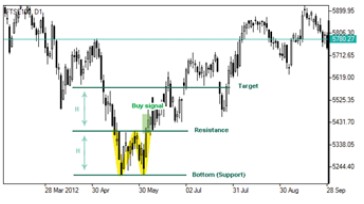
Inverse Head and Shoulders:

Inverse head and shoulders represent a trend reversal pattern indicating the change in direction of the asset’s price. Being formed in a downtrend this pattern comprises three consecutive lows of the market price which are arranged at different levels: two
higher bottoms called shoulders are located at two sides of the lowest bottom called head.
The pattern’s highs are connected by resistance level called a neckline. If the price climbs above the neckline or resistance level a buy signal arises. Though prices may rebound to the neckline forming a support level it is expected that the surging will continue.
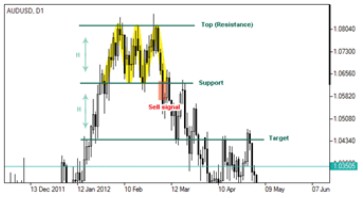
Inverse head shoulder

Double Top:

Double top represents a trend reversal pattern which precedes existing trend reversal. Though it is formed in an uptrend there is an expectation that it may be followed by a drop in prices. Moreover, if it takes much time for the pattern to be formed more reliable it will be. This pattern comprises two horizontal lines (support and resistance levels) connecting two most recent highs and a low of the price. When the market price breaks the pattern’s low or support level the formation is considered completed. In such a case it identifies downward direction of the trend serving as a signal to sell.
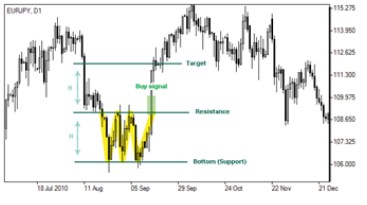
double top

Double Bottom:

Double bottom represents a trend pattern which serves as an existing downtrend reversal.
Though it is formed in a downtrend there is an expectation that it may be followed by a rally in prices. Moreover, if it takes much time for the pattern to be formed more reliable it will be. This pattern comprises two horizontal lines (support and resistance levels) connecting two most recent low and a high of the price. The two recent lows form a support level and the most recent local high is considered a resistance level.
The formation is considered to be completed when the market price breaks above the pattern’s maximum or resistance level. In such a case it identifies upward direction of the trend serving as a signal to buy.

double bottom

Triple Top:

Triple top is a price pattern which is formed in an uptrend and is followed by a drop in prices. This pattern comprises three consecutive peaks arranged at the same level and two bottoms. The highs and lows of the price are connected by resistance and support lines.
The formation is considered to be completed if the price breaks the pattern’s minimum. It can be interpreted as a downward direction of the trend serving as a signal to sell.

tripple top

Triple Bottom:

Triple bottom is a price pattern which is formed in a downtrend and is followed by a rise in prices. This pattern comprises three consecutive lows arranged at the same level and two highs located between them. The lows and highs of the price are connected by support and resistance lines respectively. The formation is considered to be completed if
the price breaks the pattern’s maximum. It can be interpreted as an upward direction of the trend serving as a signal to buy.
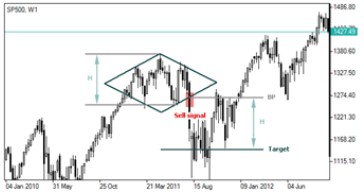
trip bott

Forex Diamond:

Diamond is a trend pattern serving as a confirmation of the existing trend reversal. Generally it tends to appear in an uptrend. This pattern is formed of four limited trend lines which represent two support lines below and two resistance lines above. Those support and resistance lines connect recent lows and highs respectively thus forming a figure which visually resembles a brilliant or a rhomb. The formation can be thought to be completed when the support line at the right is violated. Therefore it can be interpreted as a downward direction of the trend serving as a signal to sell.

forex diamond

In conclusion, it would be important to note that a reversal pattern does not necessarily suggest a complete reversal in trend. It merely indicates a change or pause in direction. This can signify anything from a slowdown in trend, sideways trading after an established trend, or a full turnaround following a reversal candle pattern.


How Binary Options Works

download (24)

Binary options offer a way to trade stocks, commodities, indices and currency pairs where your rate of return is FIXED. You just need to correctly pick whether the value of the asset is going up (Call) or down (Put). Usually, these options expire in range between 5 seconds to weekly expiries.

how it wors

From the above example, a trader forms a view that the price of gold will fall in a given period of time, and so places $100 in a put. If correct, He/She wins a fixed payout of $175. It does not matter if the price of the asset falls $1 or $100; the payout is the same. If the price of gold rises, however, the trader loses the entire amount of the investment – $100

Some brokers, let you minimize risks by choosing the payout and loss percentage. For example, you can choose to lose only 75% in the event that your view is incorrect. With such an option, you would also have to accept a lower win percentage.


Binary Options VS Forex

Profitability                 

              60% -85%


                Uncertain

Risk              Controled  

                Unpredictable

Refunds for Loses > 15% refund  

                 None

Risk/ Reward Ratio  

               Reward < Ris


                Reward > Risk

Leverage  

               Not Available


               Upto 2000% 

For beginners                Easy to use  

                More complicated

Fees                 None              

                Spread/commision              

Regulated in the U.S  

               Rarely


                Yes

Assets for Trading


               Multiple                 Limited
Ownership of Assets  

               No

                Yes

Popularity of Binary Options

Trading made Easier: Binary Options are generally simpler to trade than
other instruments. This is because you only need to form a view on what direction
the price of the underlying asset will move. In comparison, traditional options also require you to form a view on the magnitude of any price movement.
Fast Outcome: Binary Options offer contracts with short term durations, from 60seconds to weekly. This provides the binary options trader with several investment opportunities during a day. It also offers flexibility as markets change over time.
Defined Risk: When trading forex, every time you enter into a trade, you risk the entire amount of money in your trading account. With binary options, your risk is always limited to the amount you committed to that specific trade
No fees: Unlike with other trading instruments, there are usually no fees or commissions attached to Binary Options. Brokers make their money from the percentage discrepancy between what they pay out on winning trades and what they collect from losing trades.
Multiple assets: A Binary Options trader can access multiple assets such as stocks, currencies, indices and commodities. A binary options trader can trade them whenever the markets are opened.

Elliott Waves Strategy for Binary Options

Nearly every trader of Binary Options or Forex has heard of the Elliott Wave Theory and is probably fascinated by the concept. However despite its popularity, Elliott Wave is also the least correctly understood theory of technical analysis. Too many binary options traders have found the numerous rules behind Elliott Wave Theory to be overly complicated and subjective. For those who correctly understand the rules, Elliott Wave Theory has proven to be a reliable basis for interpreting and forecasting price action. For those who misinterpret the rules, incorrect forecasting will lead many to conclude that Elliott Wave Theory is obsolete. Nevertheless, many traders have used Elliott Wave Theory to successfully identify turning points in price action.

Elliott Waves Theory: The Basics

Developed by Ralph Nelson Elliott in the 1930s, Elliott Wave Theory was originally designed to forecast stock price movement. Overtime however, the theory has been applied to a variety of markets, particularly foreign exchange. Its higher popularity in the foreign exchange market stems from the fact that 80% of the volume in the FX market is speculative. This is important since waves are based upon mass psychology. Elliott Wave Theory is now a very popular analytical strategy frequently used by the technicians of leading investment banks and inter-market players and individual traders of both Forex and Binary Options..

The Elliott Wave Theory is founded on the notion that markets are not perfectly efficient. As a result, prices from one moment to the next are not random but rather subject to changes in overall investor behavior—changes that can be predictable with an understanding of mass psychology.

How to count Elliot Waves

Before understanding the waves within the Theory, it is important to remember the tenet that every action creates an opposite reaction. Applying this thought to Elliott Wave, let us take a look at the most basic wave structure. The center of the Elliott Wave Theory rests on the idea that security prices move in waves: impulsive (going in the direction of the underlying trend) and corrective (going against the underlying trend). As indicated in the diagram below, there are 5 impulsive waves and 3 corrective waves. There are of course waves within waves that we will touch upon later in the guide.

Impulsive and Corrective Waves

To fully understand the Elliot Wave Theory, it is important to understand the psychological rationale for each of these waves since the zigzag movement of prices represents the ebb and flow of investor optimism and pessimism. Given an up trending market:

Wave 1 (Impulsive): Minor Up-wave In Major Bull Move – In Wave 1, prices rise as a relatively small number of market participants buy a currency pair for either fundamental or technical reasons, pushing prices higher.

Wave 2 (Corrective): Minor Down-wave In Major Bear Move – After a significant run-up, investors may get fundamental or technical signals indicating that the currency is overbought. At such time, Wave 2 develops when original buyers decide to take profits while newcomers initiate short positions. Price action reverses, but generally does not retrace beyond its initial low that attracted buyers at Wave 1.

Wave 3 (Impulsive): Minor Up-wave In Major Bull Move – Often the longest wave of the five, Wave 3 represents a sustained rally, as a larger number of investors use the Wave 2 dip as a buying opportunity. With a broader range of buyers, the security enjoys a stronger push higher, with prices extending beyond the top formed at Wave 1.

Wave 4 (Corrective): Minor Down-wave In Major Bear Move – By Wave 4, buyers begin to become exhausted and again take profits in reaction to overbought signals. Generally, there is still a fair amount of buyers, so the retracement here is relatively shallow.

Wave 5 (Impulsive): Minor Up-wave In Major Bull Move – Wave 5 represents the final move up in the sequence. At this point, buyers as a whole are motivated more by greed than any fundamental justifications to buy, and bid prices higher irrationally. Prices make a high for the move before a correction or reversal ensues. The high in Wave 5 often coincides with a divergence in the relative strength index (RSI).

A-B-C Corrective Waves

Wave A: Correction to Rally – Initially Wave A may appear to be a correction to the normal rally. However, if it breaks down into five sub-waves, it indicates that a new market trend may have developed.

Wave B: Bear Market Correction – Wave B tends to give bears an opportunity to sell as others take profit on their short trades or exit their long positions.

Wave C: Confirms End of Rally – Wave C is the last wave of the cycle. At this point, Wave 3 typically breaks key support zones and most technical studies confirm that the rally has ended.


Wave Count Rules:

While determining waves can be extremely subjective, there are three rules to counting waves that always hold. These rules form the basic tenets of Elliott Wave Theory.

Rule 1: Wave 2 cannot retrace more than 100% of Wave 1

Violation of Rule 1:

Rule 2: Wave 4 cannot overlap Wave 1

Violation of Rule 2: 

Rule 3: Of waves 1, 3, and 5, wave 3 can never be the shortest wave (it is, in fact, often the longest)

Violation of Rule 3: 

Waves within Waves:

The primary reason why Elliott Wave Theory can be difficult to understand is because waves frequently occur at many different levels. In other words, there are minor waves within larger waves. That is why at many points in time, multiple correct wave interpretations usually exist. The major waves determine the direction of the trend, while the minor waves help to determine the minor trends. Used in conjunction, traders can apply Fibonacci ratios to Elliott Wave Theory to help determine when currencies will reach a top or bottom.

It can also be used as a tool to identify points to trade within the trend or to participate in the shorter minor wave cycles. It is important for Elliott Wave traders in Binary Options to be aware of both the minor and the major waves that may exist. The following is an example of two minor waves within larger waves:


Minimize Forecasting Errors with Elliott Waves:

Since many different waves can exist during the same time frame, increasing the risk of forecasting error, traders should follow certain rules to minimize risk. The most important of which is to follow the principle that the “the trend is your friend.” This means that it is more prudent to only look for opportunities sell into minor waves when the major wave is a downtrend and to buy when the major wave is an uptrend. More rules can be used though to determine levels for placing stop-loss orders or to exit the trade. Fibonacci ratios are one of the most useful ways of identifying possible peak or bottoms of wave cycles. A popular relationship that exists is that Wave 2 retraces 38% of Wave 1. 50% and 61.8% retracements are also frequently seen.