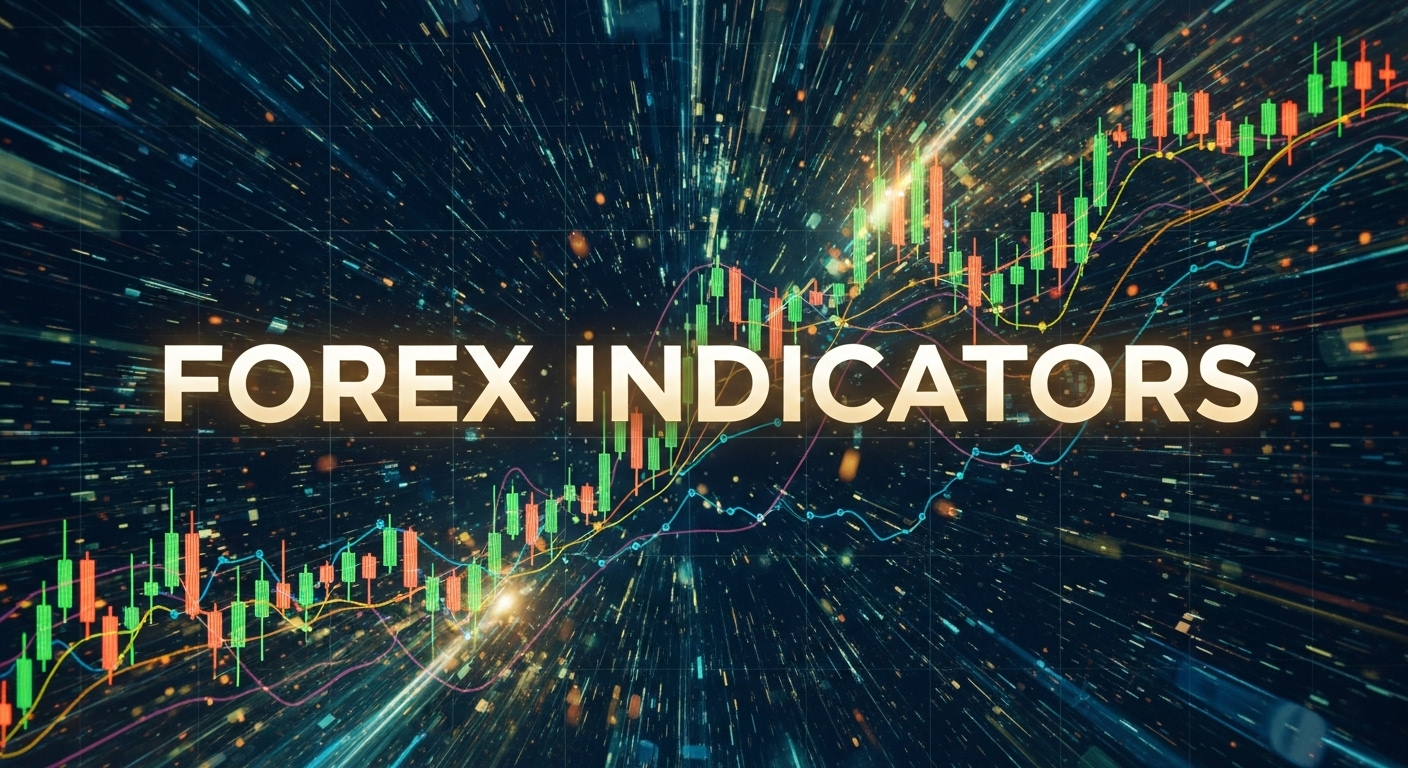
Forex indicators are mathematical calculations based on price, volume, or open interest data that help traders analyze market trends and make informed trading decisions. Think of them as your trading compass, helping you navigate the often turbulent waters of currency markets. Whether you’re a complete beginner trying to understand market movements or an experienced trader looking to refine your strategy, mastering forex indicators can be the difference between consistent profits and devastating losses.
In this comprehensive guide, we’ll demystify the world of forex indicators, explore the most effective ones used by professional traders, and show you how to implement them in your own trading strategy. By the end of this article, you’ll have the knowledge and confidence to use these powerful tools to enhance your trading performance and potentially transform your approach to the forex market.
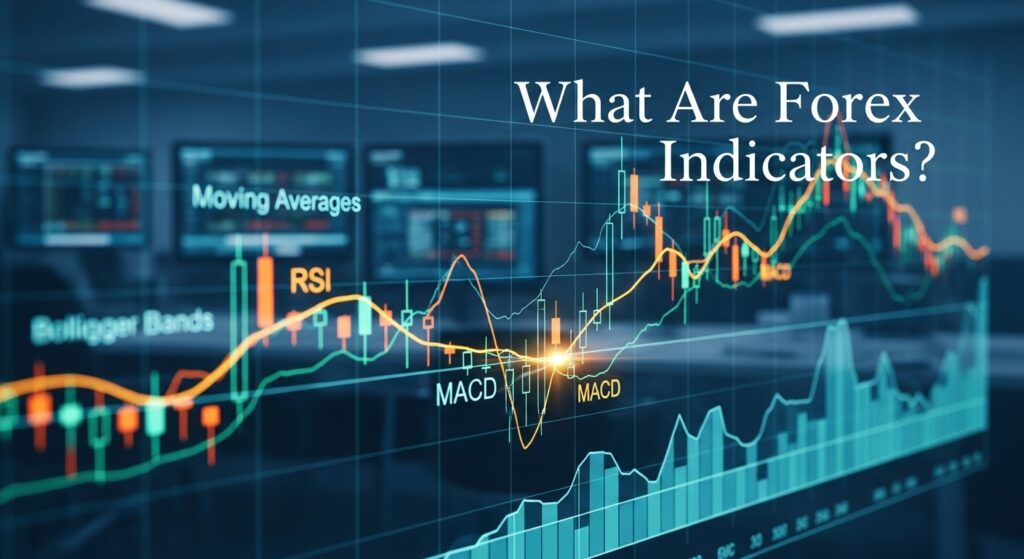
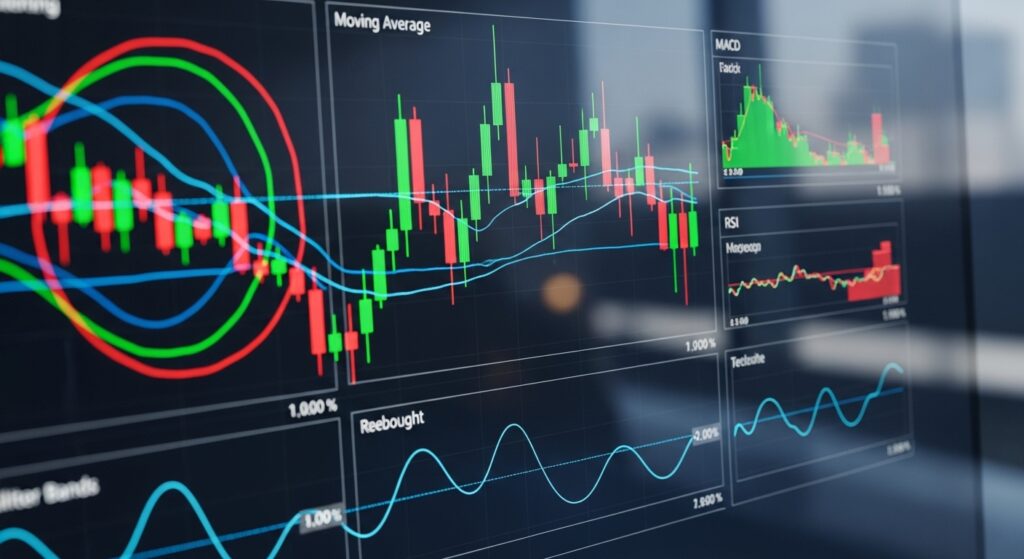
What Are Forex Indicators?
At its core, a forex indicator is a statistical tool that analyzes past and current price data to provide insights about potential future price movements. These mathematical formulas transform raw price information into visual representations that are much easier to interpret than staring at endless rows of numbers or trying to decipher complex chart patterns with the naked eye.
Think of forex indicators as your market translator. Just as a translator helps you understand a foreign language, indicators help you understand what the market is trying to tell you. They take the seemingly random price movements and convert them into actionable information about trend direction, momentum strength, volatility levels, and potential entry and exit points.
The beauty of forex indicators lies in their objectivity. While human emotions like fear and greed can cloud our judgment when analyzing charts, indicators provide cold, hard mathematical facts. They remove much of the guesswork from trading by offering quantifiable signals based on historical price behavior and statistical probabilities.
Forex indicators work by applying mathematical formulas to price data over specific time periods. For example, a simple moving average takes the closing prices of a currency pair over the last 20 days, adds them up, and divides by 20 to give you an average price. This average is then plotted on your chart as a smooth line that helps you identify the overall trend direction.
What makes indicators particularly valuable is their ability to reveal information that isn’t immediately obvious from looking at raw price action. They can show you when a trend is losing momentum before it becomes apparent on the chart, alert you to potential reversal points, and help you time your entries and exits more effectively.
However, it’s crucial to understand that forex indicators are not crystal balls. They’re based on historical data, which means they’re inherently backward-looking. The key to successful indicator-based trading is understanding their limitations while maximizing their strengths through proper application and risk management.
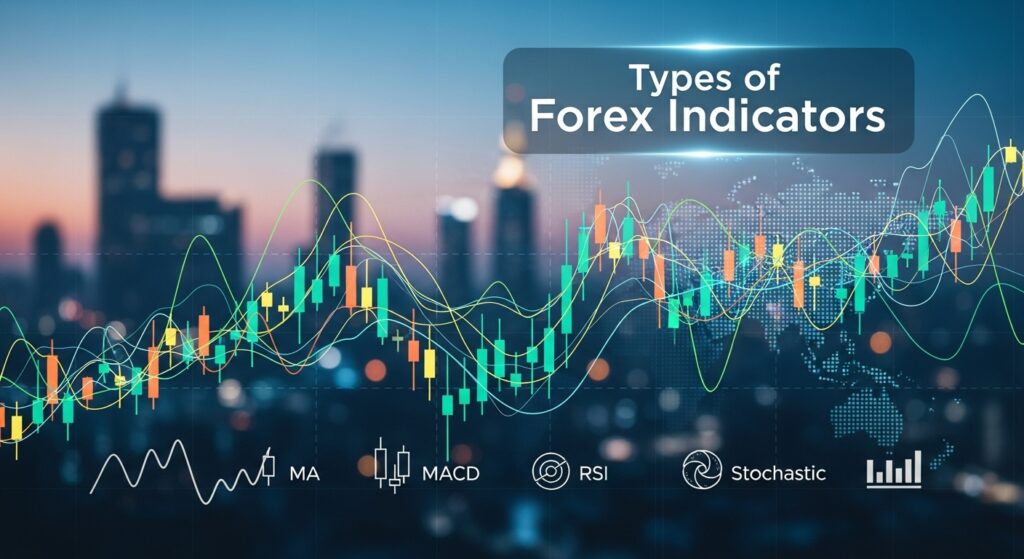
Types of Forex Indicators
The world of forex indicators can seem overwhelming at first, with dozens of different types available on most trading platforms. However, most indicators fall into four main categories, each serving a specific purpose in your trading analysis. Understanding these categories will help you choose the right tools for different market conditions and trading strategies.
Trend Indicators
These are perhaps the most fundamental type of forex indicator. These tools help you identify the overall direction of price movement and determine whether a currency pair is in an uptrend, downtrend, or moving sideways. Moving averages are the most common trend indicators, with the Simple Moving Average and Exponential Moving Average being widely used by traders worldwide. The Average Directional Index is another powerful trend indicator that not only shows trend direction but also measures trend strength.
The principle behind trend indicators is relatively straightforward: they smooth out price fluctuations to reveal the underlying directional bias of the market. When prices consistently stay above a moving average, it suggests an uptrend, while prices below the average indicate a downtrend. Professional traders often use multiple moving averages with different time periods to get a more comprehensive view of trend dynamics.
Momentum Indicators
They serve a different but equally important purpose. While trend indicators tell you which direction the market is moving, momentum indicators reveal how fast it’s moving and whether that speed is increasing or decreasing. These indicators are particularly valuable for identifying potential reversal points and confirming trend changes.
The Relative Strength Index and the Moving Average Convergence Divergence are among the most popular momentum indicators. These tools oscillate between specific values, helping traders identify overbought and oversold conditions. When the RSI reaches above 70, it often suggests that a currency pair might be overbought and due for a correction. Conversely, readings below 30 may indicate oversold conditions and a potential buying opportunity.
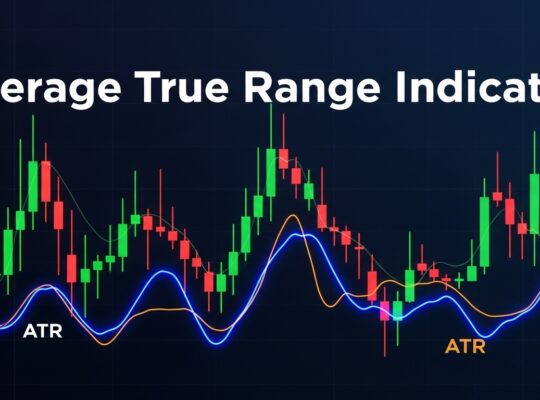
Volatility Indicators
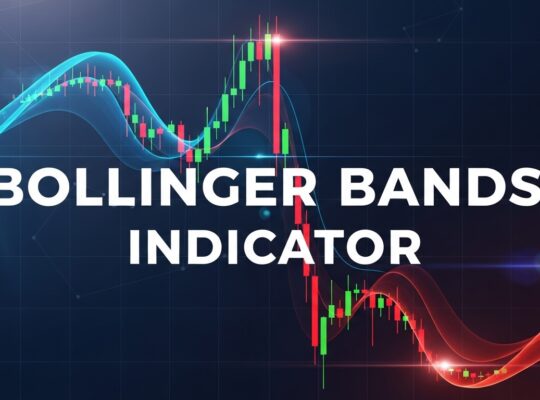
They focus on measuring the degree of price variation over time. Understanding volatility is crucial because it affects everything from position sizing to stop-loss placement. Bollinger Bands are probably the most recognizable volatility indicator, consisting of a moving average with bands above and below it that expand and contract based on market volatility.
High volatility periods present both opportunities and risks. While they can offer larger profit potential, they also increase the likelihood of sudden, unexpected price movements that can trigger stop losses. Volatility indicators help traders adjust their strategies accordingly, perhaps using wider stops during high volatility periods or reducing position sizes when uncertainty is elevated.
Volume Indicators
They analyze the amount of trading activity accompanying price movements. While volume data in forex is somewhat different from stock markets due to the decentralized nature of currency trading, volume indicators can still provide valuable insights. The On-Balance Volume and Money Flow Index are examples of indicators that attempt to gauge the strength of price movements by analyzing volume patterns.
Volume indicators work on the principle that significant price moves should be accompanied by high volume to be considered sustainable. A price breakout with low volume might be more likely to fail than one supported by strong trading activity. This makes volume indicators particularly useful for confirming other signals and avoiding false breakouts.
Most Popular Forex Indicators Explained
Now that we understand the different categories of indicators, let’s dive deep into the specific tools that professional traders use most frequently. These indicators have stood the test of time and continue to be relevant in today’s dynamic forex market.
Moving Averages
These are undoubtedly the foundation of technical analysis for most traders. The Simple Moving Average calculates the arithmetic mean of closing prices over a specific number of periods, while the Exponential Moving Average gives more weight to recent prices, making it more responsive to current market conditions. The magic happens when you start combining different moving averages or using them to identify key support and resistance levels.
One of the most powerful moving average strategies is the “golden cross” and “death cross” signals. A golden cross occurs when a shorter-period moving average crosses above a longer-period average, typically signaling the beginning of a bullish trend. Conversely, a death cross happens when the shorter average crosses below the longer one, often indicating the start of a bearish phase. These signals have been used successfully by traders for decades and continue to provide reliable entry and exit points when combined with proper risk management.
The beauty of moving averages lies in their simplicity and versatility. Day traders might use 5 and 20-period averages for quick signals, while long-term investors prefer 50 and 200-period averages for major trend identification. The key is finding the combination that works best for your trading style and the specific currency pairs you focus on.
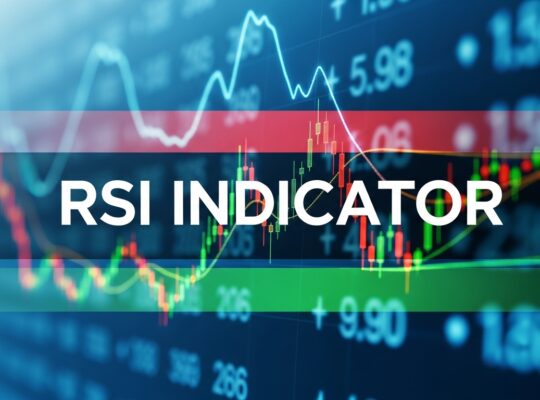
The Relative Strength Index
The RSI has earned its place as one of the most trusted momentum indicators in forex trading. Developed by J. Welles Wilder Jr. in 1978, the RSI measures the speed and magnitude of price changes on a scale from 0 to 100. What makes the RSI particularly powerful is its ability to identify potential reversal points before they become obvious on the price chart.
Traditional RSI interpretation suggests that readings above 70 indicate overbought conditions, while readings below 30 suggest oversold conditions. However, experienced traders know that the RSI’s true power lies in divergence analysis. When price makes a new high but the RSI fails to confirm with a new high of its own, it often signals weakening momentum and a potential reversal. This divergence can provide early warning signals that give traders a significant advantage.
The RSI is also valuable for trend confirmation. In strong uptrends, the RSI tends to remain in the 40-80 range, rarely dropping below 40. Similarly, in strong downtrends, the RSI typically oscillates between 20-60. Understanding these patterns helps traders avoid fighting against strong trends and instead position themselves to profit from them.
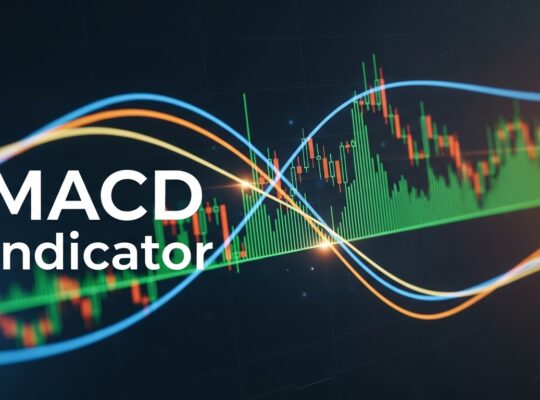
MACD, or Moving Average Convergence Divergence
The MACD is often called the “king of indicators” due to its versatility and reliability. This indicator combines trend-following and momentum characteristics, making it suitable for various market conditions and trading strategies. The MACD consists of two exponential moving averages and a histogram that measures the difference between them.
The most common MACD signals come from line crossovers and divergences. When the MACD line crosses above the signal line, it generates a bullish signal, while a cross below creates a bearish signal. However, the histogram provides equally valuable information about momentum changes. When the histogram bars are increasing, it suggests strengthening momentum in the current direction. Conversely, decreasing histogram bars warn of weakening momentum.
Professional traders often look for MACD signals that align with the overall trend direction. Bullish MACD crossovers are more reliable in uptrending markets, while bearish crossovers carry more weight in downtrending environments. This trend-confirmation approach significantly improves the accuracy of MACD signals and reduces false signals that can occur in sideways markets.
Bollinger Bands
The Bollinger Bands provide a unique perspective on price volatility and potential reversal points. Created by John Bollinger, these bands consist of a moving average with two standard deviation bands above and below it. The bands expand during periods of high volatility and contract during low volatility phases, creating a dynamic envelope around price action.
The most common Bollinger Band strategy is the “bounce” trade, where prices touch the upper or lower band and then reverse toward the middle band. This strategy works particularly well in ranging markets where prices tend to oscillate between the bands. However, in trending markets, prices can “walk the bands,” staying near the upper band during uptrends or the lower band during downtrends.
Another powerful Bollinger Band signal is the “squeeze,” which occurs when the bands contract significantly due to low volatility. These periods of contraction are often followed by explosive price moves, making them excellent opportunities for breakout traders. The key is identifying the direction of the breakout and positioning accordingly.
Leading vs. Lagging Indicators
Understanding the fundamental difference between leading and lagging indicators is crucial for developing effective trading strategies. This distinction affects everything from signal timing to risk management and can dramatically impact your trading results.
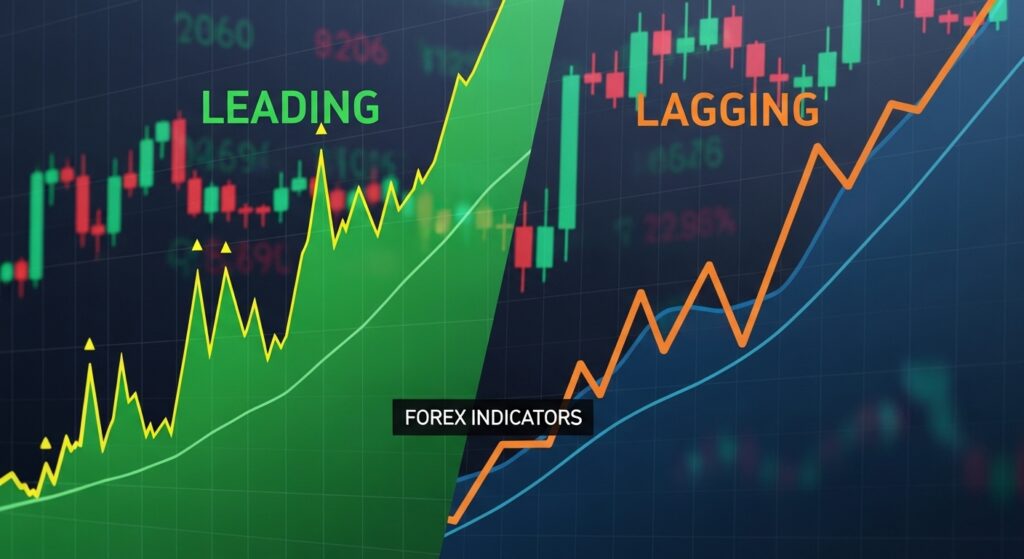
Leading indicators
Leading indicators are designed to provide signals before major price movements occur. They attempt to predict future price direction based on current market conditions and momentum. The RSI, Stochastic Oscillator, and Williams %R are prime examples of leading indicators. These tools excel at identifying potential reversal points, especially in overbought and oversold conditions.
The primary advantage of leading indicators is their ability to get you into trades early, potentially maximizing profit potential. When the RSI shows divergence with price action, it can alert you to weakening momentum before the trend actually changes direction. This early warning system allows traders to position themselves advantageously before the crowd notices the shift.
However, leading indicators come with a significant drawback: they generate more false signals than lagging indicators. Because they’re trying to predict the future based on current conditions, they can trigger alerts that don’t result in actual price reversals. This characteristic makes them particularly challenging for novice traders who might not have the experience to distinguish between valid signals and false alarms.
Lagging indicators
Lagging indicators confirm price movements that have already begun. Moving averages, MACD, and trend lines fall into this category. While they might get you into trends later than leading indicators, they provide more reliable confirmation that a trend change has actually occurred.
The strength of lagging indicators lies in their reliability and lower false signal rate. When a 50-period moving average crosses above a 200-period moving average, you can be reasonably confident that a significant trend change is underway. This confirmation reduces the likelihood of entering trades based on temporary price fluctuations or market noise.
The trade-off with lagging indicators is timing. By the time they generate signals, you might miss a significant portion of the initial price move. However, many successful traders prefer this approach because it allows them to join established trends with higher probability of success, even if they sacrifice some potential profit in exchange for greater reliability.
Combining leading and lagging indicators
Combining the two; leading and lagging indicators, creates a powerful synergy that can significantly improve your trading results. A common approach is to use leading indicators to identify potential setups and lagging indicators to confirm entry points. For example, you might wait for RSI divergence to signal a potential reversal, then use a moving average crossover to confirm the trend change before entering the trade.
This combination approach helps filter out false signals while still allowing you to capitalize on early trend changes. The leading indicator alerts you to potential opportunities, while the lagging indicator provides the confirmation needed to act with confidence. This methodology is particularly effective in volatile market conditions where false signals are more common.
How to Use Forex Indicators Effectively
The difference between profitable and unprofitable traders often comes down to how effectively they use indicators rather than which indicators they choose. Even the most powerful indicator becomes useless if applied incorrectly or without proper context.
Single indicator strategies
These can be highly effective when implemented correctly. The key is choosing an indicator that matches your trading style and market conditions, then developing a thorough understanding of its signals and limitations. Many successful traders built their entire careers around mastering just one or two indicators rather than trying to use every tool available.
Consider the simple moving average crossover strategy used by countless successful traders. When a shorter-period moving average crosses above a longer-period average, you buy. When it crosses below, you sell. This straightforward approach has generated consistent profits for decades because it keeps traders aligned with major trends while filtering out much of the market noise that causes losses.
The secret to single indicator success lies in proper parameter optimization and strict risk management. You need to test different settings to find what works best for your chosen currency pairs and timeframes. A 10-period and 20-period moving average combination might work perfectly for EUR/USD on the 4-hour chart but perform poorly on GBP/JPY on the 15-minute chart.
Multiple indicator strategies
They offer the advantage of confirmation signals, which can significantly improve accuracy. However, they require careful selection to avoid conflicting signals or over-complication. The most effective multi-indicator approaches combine tools from different categories rather than using multiple indicators of the same type.
A popular three-indicator system combines trend, momentum, and volatility analysis. You might use a moving average to identify trend direction, RSI to gauge momentum, and Bollinger Bands to assess volatility and entry timing. This combination provides a comprehensive view of market conditions while maintaining simplicity.
The challenge with multiple indicators is avoiding analysis paralysis. When you have five different indicators giving you different signals, it becomes difficult to make decisive trading decisions. Successful multi-indicator traders develop clear rules about signal priority and what to do when indicators conflict.
Timeframe considerations
Timeframes play a crucial role in indicator effectiveness. Scalpers working with 1-minute charts need fast, responsive indicators that can capture quick price movements, while swing traders on daily charts benefit from smoother, less noisy signals. The same RSI settings that work perfectly for scalping might be completely useless for position trading.
Short-term traders typically use lower parameter settings to make indicators more sensitive to recent price changes. A 14-period RSI might be too slow for a scalper who needs immediate signals, leading them to use a 7-period or even 5-period version. Conversely, long-term traders often increase parameter settings to reduce noise and focus on major movements.
Currency pair optimization
Currency pair or asset is another critical factor that many traders overlook. Different currency pairs have unique characteristics that affect indicator performance. Major pairs like EUR/USD tend to move more smoothly and predictably, making trend-following indicators more effective. Exotic pairs with higher volatility might require different approaches or parameter adjustments.
The time of day also matters significantly in forex trading. During high-impact news releases or major session overlaps, even the best indicators can generate false signals due to increased volatility and unpredictable price movements. Experienced traders learn to either avoid trading during these periods or adjust their indicator interpretation accordingly.
Market session characteristics also influence indicator effectiveness. The Asian session, known for its range-bound trading, might favor oscillating indicators like RSI and Stochastic. The European and American sessions, with their trending characteristics, might be better suited for trend-following indicators like moving averages and MACD.
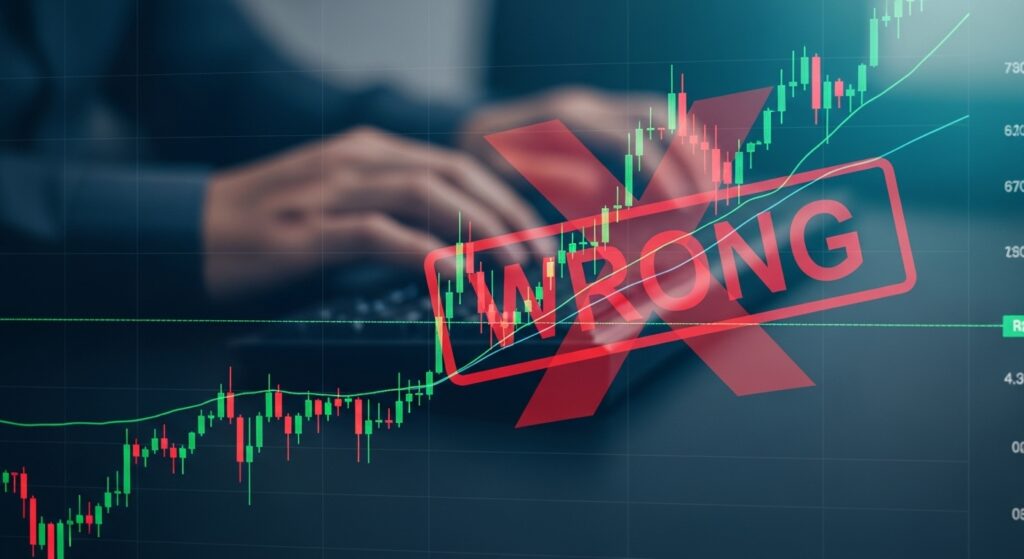
Common Mistakes When Using Forex Indicators
Even the most powerful forex indicators become ineffective when used incorrectly. Understanding and avoiding these common mistakes can dramatically improve your trading results and save you from costly errors that plague many traders.
Over-reliance on indicators
This is perhaps the most dangerous trap for developing traders. While indicators provide valuable insights, they should never become a substitute for understanding price action and market fundamentals. Some traders become so dependent on indicators that they can’t make a trading decision without multiple confirmations, leading to missed opportunities and delayed entries.
The most successful traders use indicators as tools to support their market analysis, not as the primary basis for all trading decisions. They understand that indicators are mathematical representations of past price behavior and cannot account for unexpected news events, central bank interventions, or other fundamental factors that can dramatically impact currency prices.
This over-dependence often manifests as “indicator addiction,” where traders continuously add more indicators to their charts hoping to find the perfect combination that will guarantee profits. Instead of improving performance, this approach typically creates confusion and analysis paralysis, making it harder to make clear, decisive trading decisions.
Poor parameter settings
This represent another critical error that can destroy an otherwise sound trading strategy. Many traders simply use default settings without considering whether those parameters are appropriate for their trading style, timeframe, or chosen currency pairs. Default settings are generic compromises that might not be optimal for your specific trading situation.
The danger of optimization goes beyond simply using default settings. Some traders fall into the trap of excessive curve-fitting, constantly adjusting parameters based on recent performance. This backward-looking optimization often leads to strategies that performed well in the past but fail miserably in current market conditions.
Finding the right balance requires extensive testing across different market conditions and time periods. The best parameter settings are those that perform reasonably well across various market environments rather than being perfectly optimized for one specific period. This approach creates more robust trading systems that can adapt to changing market dynamics.
Misunderstanding signal quality
This leads to countless trading losses that could be easily avoided. Not all indicator signals are created equal, and the context in which they occur dramatically affects their reliability. A bullish RSI divergence occurring at a major resistance level carries much more weight than the same signal appearing in the middle of a trading range.
Many traders treat all indicator signals as equally valid, entering trades whenever their chosen indicator generates a signal regardless of market conditions. This mechanical approach ignores the importance of confluence, where multiple factors align to support a trading decision. Professional traders look for high-probability setups where several different types of analysis confirm the same directional bias.
The timing of signals also matters significantly. An RSI oversold signal that occurs during a strong downtrend might indicate a brief pullback rather than a major reversal. Understanding the broader market context helps traders interpret signals correctly and avoid fighting against dominant trends.
Ignoring market context
is closely related to signal quality but deserves special attention because it’s such a common and costly mistake. Indicators don’t exist in a vacuum; they must be interpreted within the context of overall market conditions, economic events, and broader market sentiment.
Trading indicator signals during major news events or economic announcements can be particularly dangerous. High-impact news can cause violent price swings that render technical analysis temporarily ineffective. Experienced traders often avoid trading around these events or adjust their risk management accordingly.
Market liquidity also affects indicator reliability. During thin trading conditions, such as during holidays or between major session overlaps, price movements can become erratic and less predictable. Indicators that work well during normal market hours might generate false signals during these low-liquidity periods.
The broader economic and political environment also influences how markets react to technical signals. During periods of high uncertainty or crisis, traditional technical analysis patterns and indicator signals might break down as fundamental factors dominate price movements. Successful traders remain aware of these broader market dynamics and adjust their technical analysis accordingly.
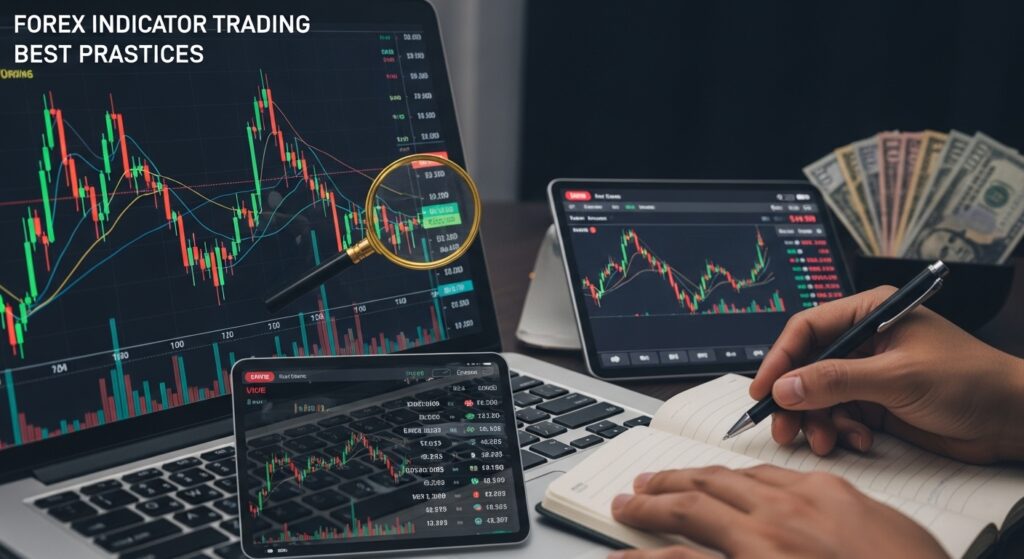
Best Practices for Forex Indicator Trading
Mastering forex indicators requires more than just understanding how they work; it demands disciplined application of proven best practices that separate consistently profitable traders from those who struggle to achieve success.
Backtesting and forward testing
Before risking real money, you must thoroughly test your approach across different market conditions and time periods. Backtesting involves applying your strategy to historical data to see how it would have performed, while forward testing means applying it to current market conditions without actually placing trades.
Effective backtesting goes beyond simply looking at win rates and profit factors. You need to analyze maximum drawdowns, consecutive losing streaks, and how your strategy performs during different market phases. A strategy that shows impressive overall returns but experiences devastating drawdowns during trending markets might not be suitable for your risk tolerance.
Forward testing, often called paper trading, provides crucial insights that backtesting cannot. It reveals how your strategy performs in real-time market conditions and helps you understand the psychological challenges of following your rules when actual money is at stake. Many strategies that look perfect in backtesting fall apart when emotional pressure is added to the equation.
The testing process should cover multiple timeframes and currency pairs to ensure your strategy’s robustness. A strategy that only works on EUR/USD during specific market hours might not provide enough trading opportunities for consistent income. Diversifying your testing across different instruments and time periods helps create more reliable and sustainable trading systems.
Risk management with indicators
Even the best indicator signals mean nothing if you don’t manage risk properly. Professional traders typically risk only 1-2% of their account balance on any single trade, regardless of how confident they feel about the setup.
Stop-loss placement should be based on logical price levels rather than arbitrary percentage amounts. Many traders use indicator levels to determine stop-loss placement, such as placing stops below recent support levels confirmed by Bollinger Bands or beyond the opposite extreme of an RSI signal. This approach ensures that your stops are placed where your analysis is proven wrong rather than at random levels.
Position sizing should reflect both your overall risk tolerance and the specific characteristics of each trade setup. High-probability setups with multiple confirmations might warrant slightly larger positions, while marginal signals should be traded with reduced size. However, never risk more than your predetermined maximum percentage per trade, regardless of how attractive the setup appears.
Risk-reward ratios must be considered before entering any trade. A strategy that generates 70% winning trades might still lose money if the average loss is significantly larger than the average gain. Successful traders typically target risk-reward ratios of at least 1:2, meaning they aim to make at least twice as much on winning trades as they lose on losing trades.
Continuous learning and adaptation
This separate traders who thrive over decades from those who experience brief periods of success followed by devastating losses. Market conditions constantly evolve, and indicators that worked well in the past might become less effective as market dynamics change.
Staying current with market developments helps you understand when your indicators might be less reliable. Changes in central bank policies, market structure, or global economic conditions can alter how markets react to technical signals. Successful traders continuously educate themselves about these broader market forces and adjust their technical analysis accordingly.
Regular strategy review and optimization prevent your trading approach from becoming stale or ineffective. This doesn’t mean constantly changing your strategy based on recent performance, but rather conducting periodic comprehensive reviews to ensure your approach remains viable. These reviews should examine both winning and losing trades to identify patterns and potential improvements.
Technology continues to advance rapidly in financial markets, creating new indicators and analytical tools. While you shouldn’t chase every new development, staying informed about technological advances can help you improve your existing strategies or develop new approaches. However, always thoroughly test any new tools before incorporating them into your live trading strategy.
Market evolution also affects indicator effectiveness over time. Increased algorithmic trading, changing market participation, and evolving global economic relationships can gradually alter how markets behave. Indicators that were highly effective decades ago might need adjustment or replacement as market characteristics change.
Free vs. Paid Forex Indicators
The decision between free and paid indicators often confuses new traders who assume that expensive tools automatically provide better results. Understanding the real differences between these options helps you make informed decisions about where to invest your money and time.

Free indicators
These are available on most trading platforms provide everything most traders need to develop profitable strategies. MetaTrader 4 and 5 come with dozens of built-in indicators, including all the classics we’ve discussed: moving averages, RSI, MACD, Bollinger Bands, and many others. These indicators have been tested by millions of traders over decades and continue to provide reliable signals when used correctly.
The main advantage of free indicators is obvious – cost. You can access powerful analytical tools without spending money on software, allowing you to focus your budget on education, better execution platforms, or risk capital. Many professional traders built successful careers using nothing but the standard indicators available on any basic trading platform.
Free indicators also benefit from widespread usage and extensive documentation. When millions of traders use the same tools, you can easily find educational resources, optimization guides, and community discussions about best practices. This collective knowledge helps accelerate your learning curve and avoid common mistakes.
However, free indicators do have limitations. They typically offer basic functionality without advanced features like custom alerts, sophisticated filtering, or integration with automated trading systems. The visual presentation might also be less polished than premium alternatives, though this rarely affects actual performance.
Paid indicators
These often provide enhanced functionality, better visual presentation, and sometimes proprietary calculations that aren’t available in standard packages. Some paid indicators combine multiple analytical methods into single tools, potentially simplifying your chart analysis and reducing the need to monitor several different indicators simultaneously.
Premium indicators might also offer advanced filtering methods to reduce false signals, custom alert systems for better trade timing, or specialized adaptations for specific market conditions. These features can provide genuine value for traders who need specific functionality that isn’t available in free alternatives.
The key question with paid indicators is whether their enhanced features justify the cost. A $200 indicator isn’t automatically better than a free moving average just because it costs money. Many expensive indicators are simply complex variations of basic concepts that don’t provide meaningful improvements in actual trading performance.
Before purchasing any paid indicator, you should thoroughly test it against free alternatives using the same trading rules and market conditions. If the paid indicator doesn’t demonstrate clear, consistent superiority over free options, the additional cost is rarely justified.
Custom indicator development
This represents another option for traders with specific analytical needs that aren’t met by existing tools. If you have a unique trading concept or want to combine several analytical methods into a single indicator, custom development might be worthwhile.
The main advantage of custom indicators is perfect alignment with your specific trading strategy and preferences. You can incorporate exactly the features you need while eliminating unnecessary complexity that might exist in generic indicators. Custom indicators can also provide competitive advantages if they reveal market insights that aren’t readily available to other traders.
However, custom development requires significant investment in both time and money. You’ll need to either learn programming yourself or hire qualified developers, both of which represent substantial costs. The development process also requires extensive testing and refinement to ensure reliability and effectiveness.
Unless you have very specific needs that can’t be met by existing indicators, custom development is usually overkill for most traders. The time and money invested in custom indicators might be better spent on improving your understanding of existing tools and developing better trading discipline.
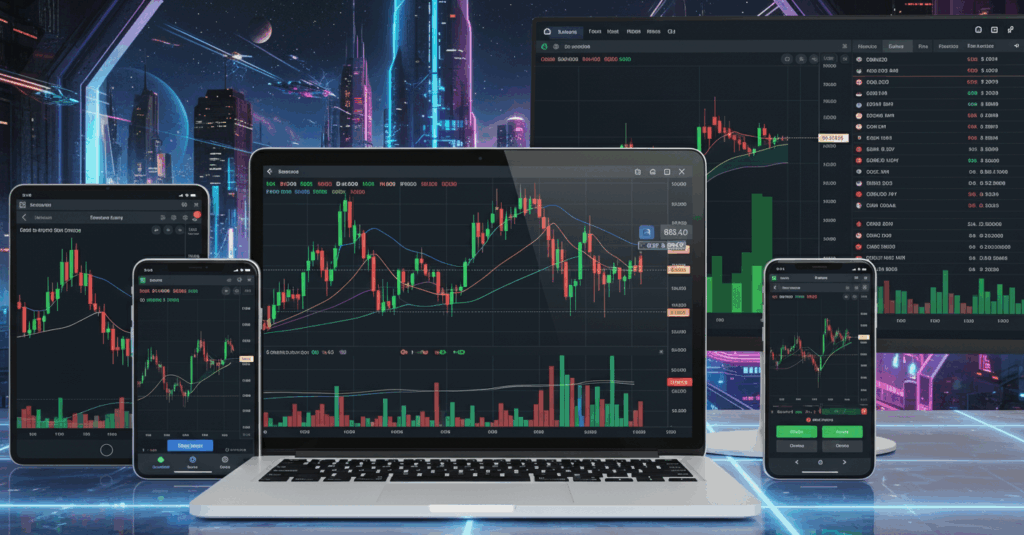
Forex Indicator Tools and Platforms
Choosing the right trading platform significantly impacts your ability to effectively use forex indicators. Different platforms offer varying levels of functionality, customization options, and indicator libraries that can enhance or limit your analytical capabilities.
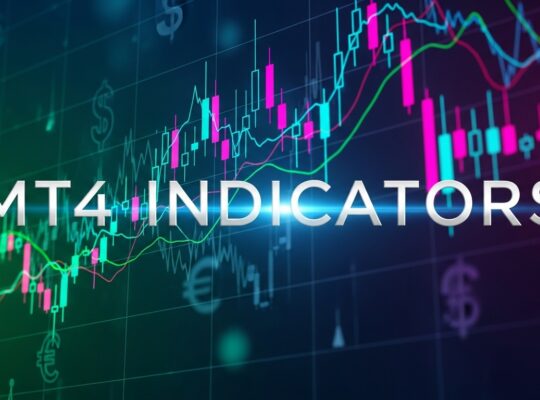
MetaTrader 4 and 5
They are the most popular choices for indicator-based trading, and for good reasons. These platforms come with comprehensive libraries of built-in indicators and support thousands of custom indicators developed by the trading community. The programming language (MQL4/MQL5) allows for sophisticated indicator development and customization that goes far beyond basic technical analysis.
The MetaTrader platform excels in indicator customization options. You can adjust colors, line styles, and display preferences to create charts that perfectly match your analytical needs and visual preferences. The ability to save custom templates means you can quickly apply your preferred indicator combinations to new charts without manually configuring each indicator every time.
MetaTrader’s automated trading capabilities also make it attractive for traders who want to develop systematic, indicator-based strategies. You can create Expert Advisors that automatically execute trades based on your chosen indicator signals, removing emotional decision-making from your trading process.
However, MetaTrader platforms can feel outdated compared to more modern alternatives, particularly in terms of user interface and chart visualization. The learning curve can also be steep for newcomers who aren’t familiar with the platform’s many features and customization options.
TradingView
It has gained popularity due to its modern interface, cloud-based operation, and extensive social features. The platform offers excellent charting capabilities with smooth performance and attractive visual presentation. The indicator library includes both built-in tools and thousands of community-developed indicators that you can easily add to your charts.
TradingView’s Pine Script programming language allows for custom indicator development, though it’s less powerful than MetaTrader’s MQL languages. The platform excels in idea sharing and social trading features, allowing you to learn from other traders’ analytical approaches and share your own insights with the community.
The main limitations of TradingView relate to direct broker integration and automated trading capabilities. While you can analyze markets effectively on TradingView, you’ll often need to execute trades through separate broker platforms, which can create timing delays and execution challenges.
Other platforms
Platforms like cTrader, NinjaTrader, and proprietary broker platforms offer their own advantages and limitations for indicator-based trading. cTrader provides excellent execution capabilities with advanced order types that work well with indicator signals. NinjaTrader offers powerful backtesting and strategy development tools for serious system traders.
Mobile trading platforms
They deserve special consideration in today’s connected world. While mobile apps can’t match desktop platforms for comprehensive analysis, many offer basic indicator functionality that allows you to monitor key signals and execute trades while away from your computer.
The key to successful mobile indicator trading is simplicity. Complex multi-indicator strategies that work well on desktop platforms often become unwieldy on small screens. Mobile trading works best with straightforward approaches using one or two key indicators that provide clear, actionable signals.
Installation and setup
The installation of indicators varies significantly between platforms, but some general principles apply across most systems. Always download indicators from reputable sources to avoid malware or poorly coded tools that might crash your platform. Test new indicators on demo accounts before using them with real money to ensure they work correctly with your broker’s data feed.
Creating and saving indicator templates saves significant time when setting up new charts. Most platforms allow you to save your preferred indicator combinations, colors, and settings as templates that can be instantly applied to any chart. This standardization also helps maintain consistency in your analysis across different currency pairs and timeframes.
Advanced Forex Indicator Concepts
As you develop expertise with basic indicator applications, advanced concepts can provide additional trading edges and deeper market insights. These sophisticated approaches require more experience and market knowledge but can significantly enhance your trading performance when properly implemented.
Indicator divergences
Divergences represent one of the most powerful advanced concepts in technical analysis. Divergence occurs when price movement and indicator movement contradict each other, often providing early warning signals of potential trend changes. Regular divergence suggests trend reversal, while hidden divergence indicates trend continuation after pullbacks.
Bullish regular divergence occurs when price makes lower lows while the indicator makes higher lows, suggesting that downward momentum is weakening despite continued price decline. This pattern often precedes upward price reversals and provides excellent low-risk entry opportunities for contrarian trades.
Bearish regular divergence shows the opposite pattern: price makes higher highs while the indicator makes lower highs, indicating weakening upward momentum. These divergences frequently occur near market tops and can help traders exit long positions or prepare for short opportunities.
Hidden divergences are more subtle but equally valuable. Bullish hidden divergence occurs when price makes higher lows while the indicator makes lower lows, suggesting that the underlying uptrend remains strong despite temporary pullbacks. This pattern helps traders identify continuation opportunities within established trends.
The key to successful divergence trading lies in confirmation and timing. Divergence signals are most reliable when they occur at significant support or resistance levels and are confirmed by other technical factors. However, divergences can persist for extended periods, so proper entry timing and risk management remain crucial.
Multi-timeframe analysis
Multi-timeframe analysis with indicators provides a more comprehensive view of market conditions than single-timeframe analysis. This approach involves analyzing the same currency pair across multiple timeframes to understand both short-term trading opportunities and longer-term trend context.
The typical approach uses a top-down analysis method: start with longer timeframes to identify the major trend direction, then move to shorter timeframes to find specific entry points. For example, you might use daily charts to identify the overall trend direction with moving averages, then switch to 4-hour charts for RSI signals that align with the major trend.
This multi-timeframe approach significantly improves signal reliability because it ensures your trades align with both short-term momentum and longer-term trend direction. Trading against the major trend, even with strong short-term signals, often leads to losses as the larger trend eventually reasserts itself.
However, multi-timeframe analysis can also create conflicting signals that complicate decision-making. When different timeframes suggest different directional biases, you need clear rules about which timeframe takes priority and how to handle these conflicts.
Algorithmic and systematic trading
Algorithmic/systematic trading with indicators represents the evolution of manual trading approaches. Many successful traders eventually develop systematic rules based on their indicator analysis and automate their execution to remove emotional decision-making and ensure consistent application of their strategies.
Systematic approaches require extensive backtesting and forward testing to ensure robustness across different market conditions. The advantage of algorithmic trading lies in its ability to execute strategies consistently without the psychological pressures that affect manual trading decisions.
However, automated systems also have limitations. They can’t adapt to unusual market conditions or account for fundamental factors that might affect technical analysis reliability. The most successful algorithmic approaches often include manual override capabilities that allow traders to intervene when market conditions deviate from historical norms.
Machine learning and artificial intelligence
These advanced methods can identify complex patterns and relationships that traditional analysis might miss, potentially providing trading edges in increasingly efficient markets.
However, AI and machine learning applications require significant technical expertise and computational resources that put them beyond the reach of most individual traders. The complexity also makes it difficult to understand why these systems generate specific signals, which can be problematic for risk management and strategy refinement.
Conclusion and Key Takeaways
Throughout this comprehensive guide, we’ve explored the fundamental principles, practical applications, and advanced concepts that make forex indicators powerful tools for trading success. The journey from basic indicator understanding to profitable implementation requires dedication, practice, and continuous learning, but the potential rewards make this effort worthwhile.
The most important lesson to remember is that forex indicators are tools, not magic solutions. They provide valuable insights into market behavior and can significantly improve your trading decisions when used correctly, but they cannot guarantee profits or eliminate the inherent risks of forex trading. Success comes from understanding their strengths and limitations while developing the discipline to apply them consistently within a comprehensive trading strategy.
Simplicity often trumps complexity in indicator-based trading. Many successful traders built their careers around mastering just a few key indicators rather than trying to use every available tool. The moving averages, RSI, MACD, and Bollinger Bands we’ve discussed in detail continue to be the foundation of successful trading strategies because they provide reliable signals when properly understood and applied.
Risk management remains absolutely crucial regardless of which indicators you choose to use. Even the most accurate indicator signals become worthless if you don’t manage your risk properly. Never risk more than you can afford to lose, always use appropriate position sizing, and remember that preserving capital during losing streaks is just as important as maximizing profits during winning streaks.
The path to indicator mastery involves continuous learning and adaptation. Markets evolve constantly, and what works today might need adjustment tomorrow. Stay curious, keep testing new approaches, and remain flexible enough to modify your strategies as market conditions change. The most successful traders treat their education as an ongoing investment that pays dividends throughout their trading careers.
Your journey with forex indicators should begin with thorough education and extensive practice on demo accounts. Don’t rush into live trading until you’ve developed confidence in your chosen approach and demonstrated consistent results over extended periods. The forex market will still be there when you’re ready, and taking time to properly prepare dramatically increases your chances of long-term success.
Remember that forex indicators work best when combined with solid understanding of market fundamentals, proper risk management, and realistic expectations. They’re powerful tools that can enhance your trading performance, but they’re most effective when used as part of a comprehensive approach that includes continuous education, disciplined execution, and patient capital growth.
Frequently Asked Questions
Frequently Asked Questions
New forex traders should start with simple, widely-used indicators that are easy to understand and interpret. Moving averages are excellent for beginners because they clearly show trend direction and provide straightforward buy and sell signals when different period averages cross. The RSI is another beginner-friendly indicator that helps identify overbought and oversold conditions on a simple 0-100 scale. MACD combines trend and momentum analysis in one tool, making it valuable for beginners who want comprehensive analysis without complexity. Start with these three indicators, master their basic applications, and gradually explore more advanced concepts as your experience grows. Avoid the temptation to use many indicators simultaneously, as this often leads to confusion and conflicting signals that make decision-making more difficult.
How many indicators should I use on one chart?
Most successful traders use between one and three indicators per chart to avoid information overload and conflicting signals. The key is choosing indicators that complement each other rather than duplicating the same information. A effective combination might include one trend indicator (like moving averages), one momentum indicator (like RSI), and one volatility indicator (like Bollinger Bands). This provides a comprehensive view of market conditions without overwhelming your analysis. Using too many indicators often leads to analysis paralysis, where you spend more time analyzing conflicting signals than actually trading. Quality of understanding matters more than quantity of indicators. Master a few key tools rather than trying to use every available indicator on your platform.
Do forex indicators work in all market conditions?
No indicator works equally well in all market conditions, which is why understanding market context is crucial for successful trading. Trend-following indicators like moving averages work best in trending markets but generate many false signals in sideways, range-bound conditions. Oscillating indicators like RSI and Stochastic perform better in ranging markets but can give premature signals in strong trending conditions. Volatility indicators like Bollinger Bands adapt better to changing conditions but require different interpretation strategies for trending versus ranging markets. Successful traders learn to identify current market conditions and adjust their indicator interpretation accordingly. During high-impact news events or major economic announcements, even the best indicators can become temporarily unreliable due to increased volatility and unpredictable price movements.
What’s the difference between indicators and oscillators?
The terms “indicators” and “oscillators” are often used interchangeably, but there are technical differences. Indicators is a broader category that includes all technical analysis tools based on mathematical calculations of price, volume, or other market data. Oscillators are a specific type of indicator that fluctuates between fixed boundaries, typically showing overbought and oversold conditions. Examples of oscillators include RSI (0-100 range), Stochastic (0-100 range), and Williams %R (-100 to 0 range). Non-oscillating indicators include moving averages, MACD (which can be unlimited in range), and trend lines. Oscillators are particularly useful for identifying potential reversal points and measuring momentum strength, while non-oscillating indicators excel at trend identification and direction confirmation. Understanding this distinction helps you choose the right tools for different trading strategies and market conditions.
How often should I adjust my indicator settings?
Indicator settings should be adjusted thoughtfully and infrequently, based on thorough testing rather than recent performance. Many traders make the mistake of constantly tweaking settings after a few losing trades, which often leads to curve-fitting that works on past data but fails in future market conditions. Instead, conduct comprehensive backtesting across different market periods and conditions to find settings that work consistently over time. Consider adjusting settings when you change trading timeframes, switch to different currency pairs, or when market volatility characteristics change significantly. However, any setting changes should be tested thoroughly before implementation in live trading. Some successful traders never change their indicator settings once they find combinations that work, preferring to maintain consistency rather than constantly optimizing. The key is finding settings that provide reliable signals across various market conditions rather than perfect optimization for specific periods.