
The Ichimoku Kinko Hyo, which translates to “one glance equilibrium chart,” is more than just another technical indicator. It’s a comprehensive trading system developed by Japanese journalist Goichi Hosoda in the late 1960s. What makes this indicator particularly compelling for forex traders is its ability to provide trend direction, momentum, support and resistance levels, and trading signals all within a single glance at your chart.
In today’s fast-paced forex market, where EUR/USD can move 100 pips in minutes and GBP/JPY volatility can spike without warning, having a reliable, all-in-one analytical tool isn’t just convenient—it’s essential. The Ichimoku system has gained tremendous popularity among professional traders precisely because it cuts through market noise and delivers clear, actionable insights.
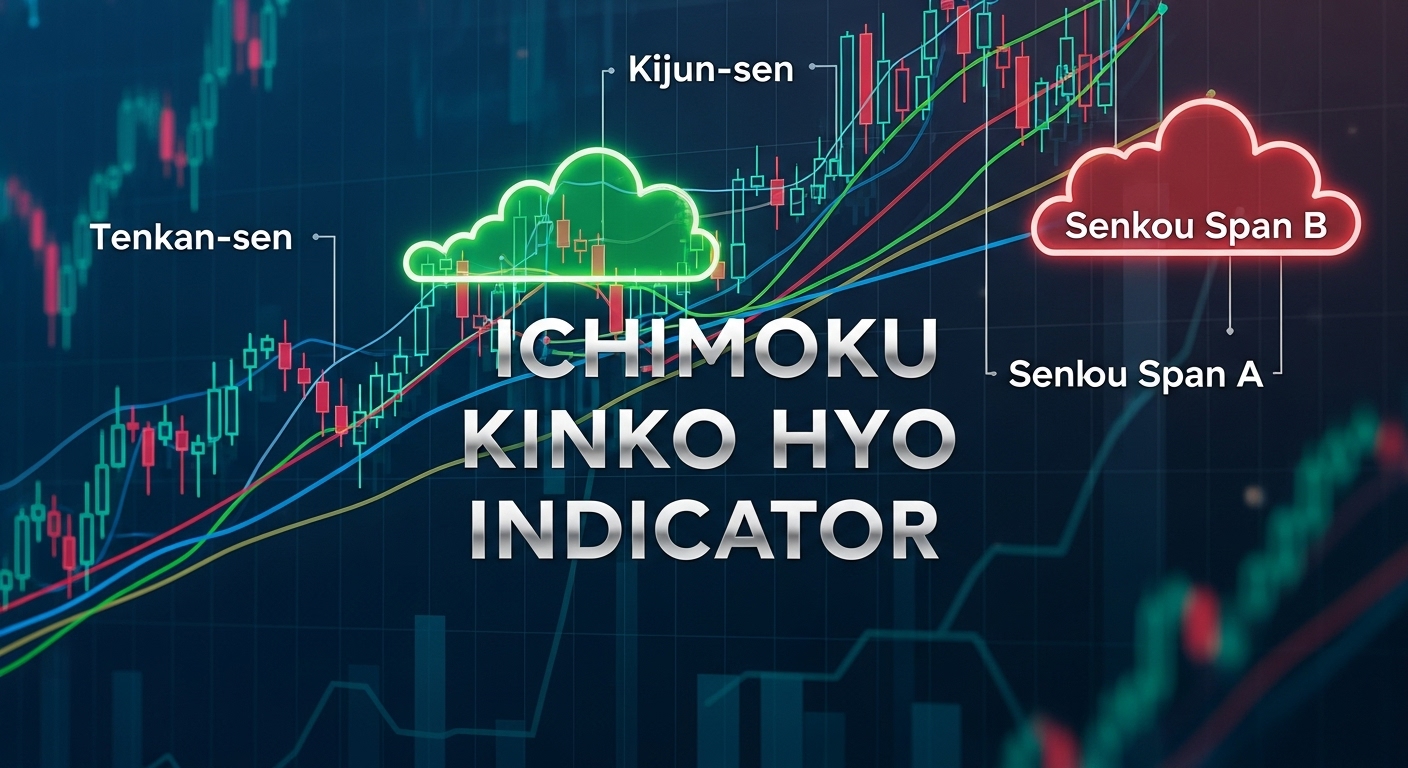
Understanding the Five Components of Ichimoku
The beauty of the Ichimoku Kinko Hyo indicator lies in its five distinct components, each serving a specific purpose in market analysis. Think of these components as different lenses through which you can view market behavior, and when combined, they create a comprehensive picture of price action.
The Tenkan-sen, or conversion line, represents the midpoint of the highest high and lowest low over the past nine periods. This line acts as a short-term trend indicator and often serves as dynamic support or resistance. When price is above the Tenkan-sen, it suggests short-term bullish momentum, while price below indicates bearish pressure. Professional traders often watch for price reactions at this level, as it frequently acts as the first line of defense in trending markets.
The Kijun-sen, known as the base line, calculates the midpoint over 26 periods and represents the medium-term trend. This component carries more weight than the Tenkan-sen due to its longer calculation period. When the Kijun-sen is flat, it indicates a ranging market, while a steep angle suggests strong trending conditions. Many traders use the Kijun-sen as a trailing stop-loss level in trending markets, as it effectively balances protection with profit potential.
The most visually striking component is the Kumo, or cloud, formed by two lines called Senkou Span A and Senkou Span B. Senkou Span A represents the average of the Tenkan-sen and Kijun-sen plotted 26 periods ahead, while Senkou Span B shows the midpoint of the 52-period high-low range, also projected forward. This forward projection creates a unique feature: the cloud shows potential future support and resistance levels, making it invaluable for planning trades in advance.
The final component, Chikou Span or lagging span, plots the current closing price 26 periods behind. While this might seem counterintuitive, the lagging span provides crucial confirmation by showing how current price action compares to historical levels. When the Chikou Span is above previous price action, it confirms bullish momentum, and vice versa for bearish conditions.
Decoding Ichimoku Trading Signals
Reading Ichimoku signals effectively requires understanding how these five components interact with each other and with price action. The most fundamental concept is the relationship between price and the cloud. When price trades above the cloud, the overall trend is considered bullish, with the cloud acting as support. Conversely, when price is below the cloud, the trend is bearish, and the cloud becomes resistance.
The thickness of the cloud provides additional insight into trend strength. A thick cloud indicates strong support or resistance and suggests that any breakout will likely be significant. A thin cloud, on the other hand, can be easily penetrated and may not provide reliable support or resistance levels. This thickness analysis helps traders gauge the conviction behind price movements and adjust position sizes accordingly.
One of the most reliable signals occurs when the Tenkan-sen crosses above the Kijun-sen while both lines are above the cloud, and price is also trading above the cloud. This alignment, known as a “strong buy signal,” suggests that short-term, medium-term, and long-term trends are all aligned bullishly. The probability of success increases significantly when all these elements align, which is why many professional traders wait for such confluence before entering positions.
The Chikou Span provides the final confirmation piece. For a truly robust bullish signal, the Chikou Span should be above the price action from 26 periods ago and trending upward. This indicates that current price levels are higher than they were in the recent past, confirming the strength of the bullish momentum. When all these conditions align, traders often see the most successful trade outcomes.
Practical Trading Strategies Using Ichimoku
The cloud breakout strategy represents one of the most straightforward applications of the Ichimoku system. When price breaks above a thick cloud after being below it for an extended period, it often signals the beginning of a significant uptrend. The key is to wait for a decisive break, not just a temporary spike that quickly retreats back into the cloud. Professional traders often wait for at least two or three candles to close above the cloud before considering entry.
For this strategy to be most effective, traders should also observe the future cloud. If the cloud ahead is thin or if Senkou Span A is above Senkou Span B (creating a bullish cloud), the breakout has a higher probability of success. Additionally, volume confirmation, where available, can provide extra conviction that the breakout is genuine rather than a false signal.
The Tenkan-Kijun cross strategy offers more frequent trading opportunities but requires careful risk management. When the Tenkan-sen crosses above the Kijun-sen, it indicates strengthening bullish momentum. However, this signal is most reliable when it occurs above the cloud or when price is approaching the cloud from below. The cross becomes even more significant when it happens at a key support or resistance level identified by previous price action.
Multiple timeframe analysis enhances the effectiveness of any Ichimoku strategy. Many successful traders use a higher timeframe to identify the overall trend direction and then drop to a lower timeframe to fine-tune their entries. For instance, if the daily chart shows a strong bullish signal above the cloud, traders might use the 4-hour or 1-hour chart to identify precise entry points during pullbacks to the Tenkan-sen or Kijun-sen.
Risk management with Ichimoku often involves using the various components as dynamic stop-loss levels. In a bullish trend, traders might place their stop-loss below the Kijun-sen, as a break below this level often indicates that the medium-term trend is weakening. More conservative traders might use the cloud as their stop-loss level, accepting larger potential losses in exchange for giving their trades more room to breathe.
Advantages and Limitations of Ichimoku Analysis
The comprehensive nature of the Ichimoku system represents its greatest strength. While most indicators focus on a single aspect of market behavior, Ichimoku provides trend direction, momentum, and support/resistance levels simultaneously. This completeness means traders can make more informed decisions without cluttering their charts with multiple indicators that might provide conflicting signals.
The forward-looking aspect of the cloud sets Ichimoku apart from most technical indicators, which are inherently backward-looking. By projecting the cloud 26 periods into the future, traders can identify potential support and resistance levels before price reaches them. This foresight allows for better trade planning and position management, as traders can anticipate where price might encounter obstacles or find support.
However, the Ichimoku system does have limitations that traders must understand. The indicator works best in trending markets and can provide numerous false signals during ranging or choppy market conditions. When markets are consolidating, the multiple crossovers between the Tenkan-sen and Kijun-sen can lead to whipsaw trades that erode trading capital.
The complexity of the system can also be overwhelming for newer traders. With five different components to monitor and multiple conditions to align for the strongest signals, beginners might find themselves paralyzed by analysis rather than taking decisive action. Additionally, like all technical indicators, Ichimoku is based on historical price data and cannot predict fundamental events that might cause sudden market reversals.
The lagging nature of some components means that Ichimoku signals often confirm moves that are already underway rather than predicting them in advance. While this confirmation aspect helps reduce false signals, it also means that traders might miss the very beginning of strong moves, entering after some of the profit potential has already been realized.
Conclusion
The Ichimoku Kinko Hyo indicator offers forex traders a sophisticated yet practical approach to market analysis. Its ability to combine trend identification, momentum measurement, and support/resistance analysis into a single system makes it an invaluable tool for traders seeking clarity in complex market environments. The key to success with Ichimoku lies not in memorizing complicated rules, but in understanding how its five components work together to paint a complete picture of market sentiment.
Remember that no indicator, regardless of how comprehensive, guarantees trading success. The Ichimoku system is most effective when combined with sound risk management principles, proper position sizing, and a thorough understanding of fundamental market drivers. Start by practicing with the indicator on demo accounts, focusing on the major signals rather than trying to trade every minor crossover or signal.
As you develop proficiency with Ichimoku analysis, you’ll likely find that it becomes more than just a technical tool—it becomes a lens through which you view and understand market behavior. The clarity it provides can help you stay focused on the bigger picture while avoiding the noise that often leads to poor trading decisions.
Take the next step in your trading journey by implementing Ichimoku analysis in your market studies. Begin with the major currency pairs where you have the most experience, and gradually expand your application as your confidence grows. Share your experiences and questions in the comments below, and consider subscribing to our newsletter for more advanced trading strategies and market insights.
Frequently Asked Questions
What does Ichimoku Kinko Hyo mean and why was it created?
Ichimoku Kinko Hyo translates to “one glance equilibrium chart” and was developed by Japanese journalist Goichi Hosoda in the late 1960s. Hosoda wanted to create a complete trading system that could provide all necessary market information at a single glance, eliminating the need for multiple indicators. The system took him over 30 years to develop and test before he released it to the public.
How do I know when the Ichimoku cloud is giving a strong buy or sell signal?
A strong buy signal occurs when price is above the cloud, the Tenkan-sen crosses above the Kijun-sen above the cloud, and the Chikou Span is above the price from 26 periods ago. All these elements should align to confirm bullish momentum. For sell signals, the opposite conditions apply: price below cloud, Tenkan-sen crossing below Kijun-sen below the cloud, and Chikou Span below historical price levels.
Can Ichimoku be used effectively on shorter timeframes like 15-minute or 1-hour charts?
While Ichimoku can be applied to any timeframe, it tends to be more reliable on longer timeframes such as 4-hour, daily, or weekly charts. Shorter timeframes often produce more false signals due to market noise. However, many traders successfully use shorter timeframes for entry timing after identifying the main trend direction on higher timeframes.
What’s the difference between a thick cloud and a thin cloud in Ichimoku analysis?
A thick cloud indicates strong support or resistance and suggests that any breakout will be significant and likely to continue. A thin cloud can be easily penetrated and may not provide reliable support or resistance. The thickness is determined by the distance between Senkou Span A and Senkou Span B—the greater the distance, the thicker the cloud and the stronger the support/resistance level.
Should I use Ichimoku alone or combine it with other indicators?
Ichimoku is designed to be a complete trading system on its own, but many traders enhance it with volume indicators or fundamental analysis for additional confirmation. However, avoid combining it with too many other technical indicators as this can lead to analysis paralysis and conflicting signals. If you do add other tools, choose ones that complement rather than duplicate Ichimoku’s functions, such as volume or market sentiment indicators.