Moving Average Convergence Divergence or MACD as it is more commonly known was developed by Gerard Appel to trade 26 and 12- week cycles in the stock market. MACD is a type of oscillator that can measure market momentum as well as follow or indicate the trend.
MACD consist of two lines, the MACD line and the signal line. The MACD line measures the difference between a short Exponential Moving Average and a long Exponential Moving Average. The Signal line is an Exponential Moving Average of the MACD line. MACD oscillates above and below the zero line without upper and lower boundaries. There is another form of MACD, which displays the difference between the MACD Lind and the Signal Line as a histogram. MACD forest displays the positive and negative difference between the two lines found in the MACD graph (the MACD Line and the Signal Line) as a histogram above and below a zero line.
The default periods are the same as the periods used by Appel. Remember that Appel used 26 and 12 because he observed weekly cycles of similar length in the US stock market. You may wish to change parameters to match another cycle period you have observed.
The most common uses of MACD in Binary Options are to:
- Generate buy and sell signals
Signals are generated when the MACD Line and the Signal Line cross. A buy signal occurs when the MACD Line crosses from below to above the Signal Line, the further below the zero line that this occurs, the stronger the signal. A sell signal occurs when the MACD Line crosses from above to below the Signal Line, the further above the zero line that this occurs the stronger the signal.
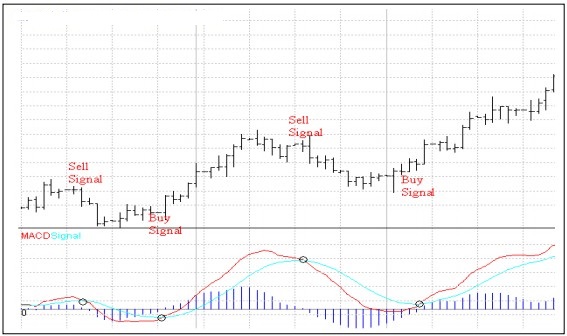
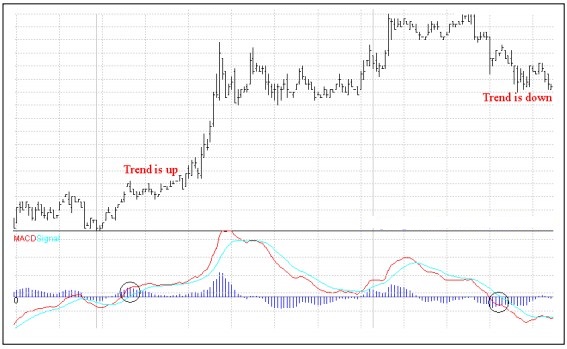
If a trend is gaining momentum, then the difference between the short and long moving average will increase. This means that if both MACD lines are above (below) zero and the MACD Line is above (below) the signal line, then the trend is up (down).
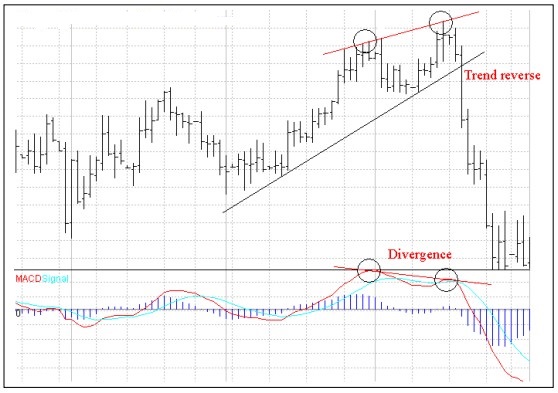
Divergence between the MACD and the price indicates that an up or down move is weakening. Bearish Divergence occurs when prices are making higher highs, but the MACD is making lower highs. This is a sign that the up move is weakening. Bullish Divergence occurs when prices are making lower lows, but the MACD is making higher lows. This is a sign that the down move is weakening. It is important to note that although divergences indicate a weakening trend they do not in themselves indicate that the trend has reversed. The confirmation or signal that mostly comes from price action, for example a trend line break.
Parameters
Short averaging period: (default 12)
Long averaging period: (default 26)
Signal line averaging period: (default 9)
The default periods are the same as the periods used by Appel. Remember that He used 26 and 12 because he observed weekly cycles of similar length in the US stock market. You may wish to change the parameters to match another cycle period you have observed.