MetaTrader 4 has become the gold standard for forex trading platforms, and for good reason. Its robust collection of built-in indicators, combined with the ability to install custom tools, makes it a powerhouse for technical analysis. Whether you’re a complete beginner trying to understand the basics or an experienced trader looking to refine your strategy, mastering MT4 indicators can be the difference between consistent profits and frustrating losses.
In this comprehensive guide, we’ll walk through everything you need to know about MT4 indicators. From understanding the fundamental concepts to implementing advanced strategies, you’ll discover how to harness the power of technical analysis to improve your trading results. We’ll explore the most effective indicators, show you how to install and configure them properly, and reveal the secrets that professional traders use to combine multiple indicators for maximum accuracy.
What Are MT4 Indicators? Understanding the Basics

MT4 indicators are mathematical calculations based on historical price data, volume, or other market metrics that help traders analyze market conditions and predict future price movements. Think of them as your trading compass, providing guidance in the often chaotic world of forex markets. These tools transform raw price data into visual representations that make it easier to spot trends, identify entry and exit points, and manage risk effectively.
The beauty of indicators lies in their ability to remove emotion from trading decisions. While human psychology often leads to poor timing and impulsive choices, indicators provide objective, data-driven insights based on mathematical formulas. They act as a filter, helping you focus on high-probability trading opportunities while avoiding the noise that can cloud judgment.
Understanding the distinction between leading and lagging indicators is crucial for effective trading. Leading indicators, such as the Relative Strength Index (RSI) or Stochastic Oscillator, attempt to predict future price movements by identifying overbought or oversold conditions. These tools can provide early warning signals but may also generate false signals in trending markets. Lagging indicators, like moving averages or MACD, confirm trends that are already in motion. While they may enter trades later, they tend to be more reliable in established trends.
MetaTrader 4 comes equipped with over 30 built-in indicators covering various aspects of technical analysis. These default indicators have been tested by millions of traders worldwide and provide a solid foundation for most trading strategies. However, the platform’s real strength lies in its ability to accommodate custom indicators created by the trading community. These custom tools, often available for free, can provide specialized analysis for specific market conditions or trading styles.
The key to success with MT4 indicators isn’t using as many as possible, but rather understanding how each one works and selecting the right combination for your trading strategy. Each indicator has its strengths and weaknesses, and knowing when to apply them can make the difference between profitable and losing trades.
Categories of MT4 Indicators
MT4 indicators can be broadly classified into four main categories, each serving a specific purpose in technical analysis. Understanding these categories helps you select the right tools for different market conditions and trading objectives.
Trend Indicators
Trend Indicators form the backbone of most successful trading strategies. These tools help identify the direction and strength of market trends, allowing traders to align their positions with the dominant market force. Moving averages are perhaps the most fundamental trend indicators, smoothing out price fluctuations to reveal the underlying direction. The Simple Moving Average (SMA) gives equal weight to all prices in its calculation period, while the Exponential Moving Average (EMA) places more emphasis on recent prices, making it more responsive to current market conditions.
The Moving Average Convergence Divergence (MACD) combines trend-following and momentum characteristics, making it one of the most versatile indicators available. It consists of two moving averages and a histogram, providing multiple signals for trend direction, momentum changes, and potential reversal points. The Average Directional Index (ADX) measures trend strength without indicating direction, helping traders determine whether a market is trending strongly enough to warrant trend-following strategies.
Oscillators
Oscillators excel at identifying overbought and oversold conditions, particularly in ranging markets. The Relative Strength Index (RSI) measures the speed and magnitude of price changes, oscillating between 0 and 100. Values above 70 typically indicate overbought conditions, while readings below 30 suggest oversold conditions. However, experienced traders know that these levels can remain extreme for extended periods during strong trends.
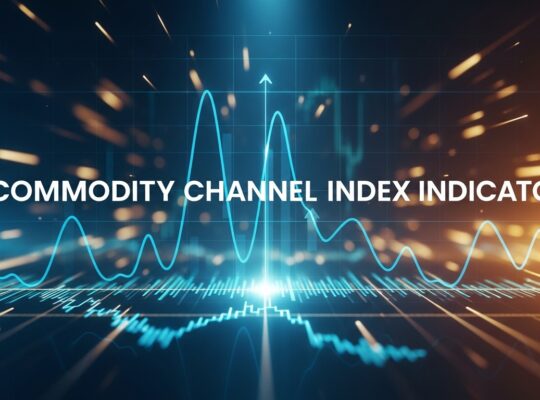
The Stochastic Oscillator compares a currency pair’s closing price to its price range over a specific period, generating signals through the interaction of its %K and %D lines. Williams %R provides similar functionality but with inverted scaling, while the Commodity Channel Index (CCI) helps identify cyclical turns in currency prices.
Volume Indicators
Volume Indicatorsanalyze trading activity to confirm price movements and identify potential reversals. While forex markets don’t have centralized volume data like stock markets, MT4 uses tick volume as a proxy. The On-Balance Volume (OBV) combines price and volume to show whether money is flowing into or out of a currency pair. The Money Flow Index acts as a volume-weighted RSI, providing additional confirmation for overbought and oversold conditions.
Support and Resistance Indicators
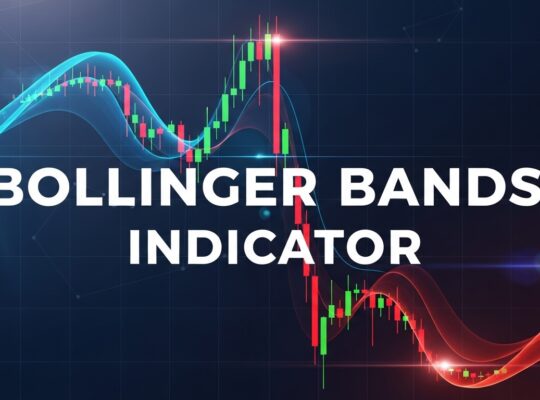
Support and Resistance Indicators help identify key price levels where buying or selling pressure may emerge. Pivot Points calculate potential support and resistance levels based on previous session’s high, low, and closing prices. Fibonacci Retracements identify potential reversal levels based on the mathematical relationships found in nature. Bollinger Bands create dynamic support and resistance levels based on price volatility, expanding during volatile periods and contracting during quiet market conditions.
Top 10 Best MT4 Indicators for Forex Trading
Selecting the right indicators can dramatically improve your trading performance, but with hundreds of options available, knowing where to start can be overwhelming. Based on decades of collective trading experience and statistical analysis, these ten indicators have proven their worth across different market conditions and trading styles.
Moving Averages
Moving Averages deserve the top spot for their simplicity and effectiveness. The 20-period EMA works exceptionally well for short-term trading, responding quickly to price changes while filtering out minor fluctuations. For longer-term analysis, the 50-period and 200-period EMAs provide excellent trend identification. When price trades above these moving averages, it suggests an upward bias, while trading below indicates bearish sentiment. The classic “golden cross” occurs when a shorter-period moving average crosses above a longer one, often signaling the beginning of a significant uptrend.
Professional traders often use multiple timeframe analysis with moving averages. A currency pair trending above the 200-period EMA on the daily chart while finding support at the 20-period EMA on the 4-hour chart presents a high-confidence long opportunity. The beauty of moving averages lies in their versatility – they work as dynamic support and resistance levels, trend filters, and trailing stops.
The Relative Strength Index (RSI)
The RSI has earned its reputation as one of the most reliable momentum oscillators. Developed by J. Welles Wilder Jr., the RSI measures the ratio of upward price movements to downward movements over a specified period, typically 14 periods. While traditional overbought (70) and oversold (30) levels provide basic signals, experienced traders look for divergence patterns where the RSI makes higher highs while price makes lower highs, or vice versa.
RSI divergence often precedes significant price reversals, making it an invaluable tool for timing entries and exits. In trending markets, traders adjust these levels to 80/20 for uptrends and maintain the standard 70/30 for ranging conditions. The RSI also works excellently as a trend filter – buying signals are more reliable when the RSI is above 50, and selling signals carry more weight when below 50.
MACD (Moving Average Convergence Divergence)
The Macd provides multiple layers of information in a single indicator. The MACD line represents the difference between a fast EMA (typically 12-period) and a slow EMA (usually 26-period). The signal line, a 9-period EMA of the MACD line, generates buy and sell signals through crossovers. The histogram shows the difference between the MACD line and signal line, providing early warning of momentum changes.
Traders use MACD in various ways, from simple signal line crossovers to complex divergence analysis. When the MACD line crosses above the signal line while both are below zero, it often indicates the beginning of an uptrend. Conversely, bearish crossovers above zero suggest potential downward moves. The histogram’s movement toward or away from zero provides additional confirmation of momentum strength.
Bollinger Bands
The Bollinger Bands create a dynamic trading envelope around price action, adapting to market volatility in real-time. Consisting of a middle line (typically a 20-period SMA) and upper and lower bands set at two standard deviations, Bollinger Bands expand during volatile periods and contract during quiet phases. This adaptability makes them incredibly useful for identifying breakout opportunities and mean reversion trades.
The “Bollinger Squeeze” occurs when the bands contract significantly, indicating low volatility that often precedes explosive moves. Experienced traders wait for price to break outside the bands on increased volume, then ride the momentum in the breakout direction. In ranging markets, the bands act as dynamic support and resistance, with price often bouncing between the upper and lower bands.
Stochastic Oscillator
The Stochastic oscillator excels at identifying turning points in price action by comparing the current closing price to the recent trading range. The fast %K line and the slower %D line (a moving average of %K) generate signals through their interaction and position relative to overbought (80) and oversold (20) levels. Unlike RSI, Stochastic tends to stay at extreme levels for shorter periods, making it particularly useful for timing entries in counter-trend scenarios.
Stochastic divergence patterns often provide early warning of trend changes. When price makes new highs but Stochastic fails to confirm with higher highs, it suggests weakening momentum and potential reversal. The indicator works best in ranging markets but can be adapted for trending conditions by adjusting the signal levels to 85/15.
Fibonacci Retracement
The Fibonacci levels have an almost mystical quality in financial markets, appearing repeatedly at key reversal points across all timeframes. Based on the mathematical sequence discovered by Leonardo Fibonacci, these ratios (23.6%, 38.2%, 50%, 61.8%, and 78.6%) often mark areas where price finds support or resistance during pullbacks in trending markets.
The 61.8% retracement level, known as the “golden ratio,” frequently marks the maximum pullback before trend resumption. Skilled traders combine Fibonacci levels with other indicators for confluence, such as waiting for RSI to show oversold conditions at a key Fibonacci support level before entering long positions. Fibonacci extension levels (127.2%, 161.8%, 261.8%) help identify potential profit targets in trending moves.
Ichimoku Cloud
The Ichimoku cloud system provides a complete trend analysis framework in a single indicator. Developed by Japanese journalist Goichi Hosoda, Ichimoku consists of five lines that work together to identify trend direction, momentum, and potential reversal points. The cloud (Kumo) formed by Senkou Span A and Senkou Span B acts as dynamic support and resistance, while the Tenkan-sen and Kijun-sen lines provide shorter-term signals.
One of Ichimoku’s greatest strengths is its forward-looking nature – the cloud is plotted 26 periods ahead, providing a glimpse of future support and resistance levels. When price trades above a rising cloud, it indicates a strong uptrend. Cloud twists, where the Senkou spans change positions, often mark significant trend changes and provide excellent trading opportunities.
The Average Directional Index (ADX)
The ADX measures trend strength without indicating direction, making it an excellent filter for other indicators. Values above 25 suggest a trending market suitable for trend-following strategies, while readings below 20 indicate choppy, directionless conditions better suited for range-trading approaches. The accompanying +DI and -DI lines show the direction of the trend, with +DI above -DI indicating upward momentum.
ADX excels at keeping traders out of poor-quality trades during consolidation periods. Many profitable strategies combine ADX with directional indicators, only taking long trades when ADX is rising above 25 and +DI is above -DI. This filter dramatically improves win rates by ensuring trades align with strong, established trends.
Parabolic SAR
The Parabolic Sar provides both trend direction and potential exit points in a single indicator. The dots appear above price during downtrends and below price during uptrends, flipping position when the trend changes. This indicator excels as a trailing stop mechanism, allowing traders to stay in profitable trends while protecting against reversals.
The sensitivity of Parabolic SAR can be adjusted through its acceleration factor and maximum step parameters. Conservative settings (0.02 start, 0.2 maximum) work well for longer-term trends, while more aggressive settings (0.02 start, 0.4 maximum) provide tighter stops for shorter-term trading. The indicator works best in trending markets and can generate excessive false signals during sideways movement.
Support and Resistance Levels
Support and Resistance while not technically indicators in the mathematical sense, are among the most powerful tools in technical analysis. These horizontal and diagonal lines mark areas where price has previously found buying or selling interest and often continue to influence future price action. Professional traders identify these levels using swing highs and lows, previous breakout points, and psychological price levels.
The strength of support and resistance levels increases with the number of times price has tested them and the volume at which these tests occurred. When a resistance level is finally broken, it often becomes support for future price action, a concept known as role reversal. Combining support and resistance analysis with momentum indicators provides high-probability trading setups.
How to Install MT4 Indicators
Installing MT4 indicators properly is essential for accessing the full range of technical analysis tools available to forex traders. While MetaTrader 4 comes with a comprehensive set of built-in indicators, the platform’s true power emerges when you add custom indicators created by the trading community.
The process begins with finding the MetaTrader 4 data folder on your computer. The easiest method is to open MT4, click on “File” in the top menu, then select “Open Data Folder.” This action opens Windows Explorer directly to the correct location. Alternatively, you can navigate manually to the folder, typically located at C:\Users[YourUsername]\AppData\Roaming\MetaQuotes\Terminal[Terminal ID]\MQL4 on Windows systems.
Within the data folder, you’ll find several subfolders, with “MQL4” being the most important for indicator installation. Inside MQL4, locate the “Indicators” folder – this is where all custom indicators must be placed. Custom indicators come in two file formats: .ex4 files (compiled) and .mq4 files (source code). Both formats work identically, though .mq4 files can be modified if you understand MQL4 programming language.
After downloading an indicator file from a reputable source, simply copy it into the Indicators folder. It’s crucial to ensure the file comes from a trusted website, as malicious indicators can pose security risks. Reputable sources include the MQL5.com community marketplace, established forex forums, and verified trading education websites. Always scan downloaded files with antivirus software before installation.
Once the file is in the correct folder, you need to refresh MT4’s navigator window to see the new indicator. Right-click anywhere in the Navigator panel (typically on the left side of your screen) and select “Refresh.” Alternatively, you can restart MetaTrader 4 entirely, which automatically loads all available indicators.
To apply an indicator to a chart, simply drag it from the Navigator window onto the chart or double-click the indicator name. A settings dialog box will appear, allowing you to customize parameters such as calculation periods, colors, and alert settings. Each indicator has default settings that work well for most situations, but experienced traders often adjust these parameters based on their trading style and market conditions.
Common installation issues include placing files in the wrong folder, incorrect file formats, or corrupted downloads. If an indicator doesn’t appear in the Navigator after installation, double-check that it’s in the MQL4\Indicators folder and that the file isn’t corrupted. Some indicators require specific libraries or additional files – always read the installation instructions provided by the indicator’s creator.
For indicators that generate alerts or send notifications, you may need to enable the “Allow live trading” option in MT4’s Expert Advisors tab. This setting is found in Tools > Options > Expert Advisors. Additionally, ensure that the “Allow imports of external experts” and “Allow imports of DLL” options are enabled if the indicator requires these features.
Best Free MT4 Indicators and Where to Download Them
The forex trading community has created thousands of free MT4 indicators, many of which rival expensive commercial alternatives in terms of functionality and accuracy. Knowing where to find reliable, high-quality free indicators can significantly enhance your trading toolkit without straining your budget.

The MQL5.com community marketplace stands as the most authoritative source for MT4 indicators. This official MetaQuotes platform hosts thousands of free and paid indicators, with user ratings, reviews, and download statistics helping you identify the most popular and effective tools. The platform’s strict quality control and review process ensure that indicators meet basic functionality standards and are free from malicious code.
Popular free indicators on MQL5 include advanced versions of classic tools like multi-timeframe moving averages, enhanced RSI indicators with alert capabilities, and sophisticated support and resistance tools. The platform’s search and filtering options make it easy to find indicators by category, rating, or specific functionality. Each indicator listing includes detailed descriptions, screenshots, and user comments providing valuable insights into real-world performance.
Established forex forums and communities represent another excellent source for free indicators. Websites like Forex Factory, BabyPips, and ForexPeaceArmy have active communities where experienced traders share their favorite tools and modifications of classic indicators. These communities often provide detailed discussions about indicator performance, optimization tips, and integration strategies with existing trading systems.
Many professional trading educators and analysts offer free indicators as part of their educational content. These tools are often well-documented with video tutorials explaining their proper use and integration into complete trading strategies. While these indicators may serve as lead magnets for paid courses or services, they’re typically high-quality tools that can stand alone as valuable additions to your trading arsenal.
When downloading free indicators, exercise caution and follow security best practices. Only download from reputable sources with positive community feedback and avoid indicators that request excessive permissions or seem too good to be true. Legitimate indicators should come with documentation explaining their functionality, calculation methods, and recommended settings.
Be particularly wary of indicators that promise unrealistic results, such as “95% win rate” or “never lose again” claims. Professional traders understand that no single indicator can guarantee success, and legitimate tool creators focus on providing useful analytical capabilities rather than making exaggerated performance claims.
Some of the most valuable free indicators include enhanced versions of classic tools with additional features like multi-timeframe analysis, alert capabilities, or improved visual presentation. For example, advanced moving average indicators that display multiple periods simultaneously or RSI tools that show divergence automatically can significantly streamline your analysis process.
How to Combine Multiple Indicators for Better Results
The art of combining multiple MT4 indicators lies in creating confluence – situations where several different analytical tools point to the same conclusion. Professional traders rarely rely on a single indicator for trading decisions, instead building robust systems that use multiple tools to confirm signals and filter out false entries.
Effective indicator combination starts with understanding the different types of information each tool provides. Combining indicators that measure the same market aspect, such as using multiple momentum oscillators together, often creates redundant signals and doesn’t improve decision quality. Instead, successful strategies typically combine trend, momentum, and volume indicators to create a comprehensive market analysis framework.
A classic example of effective combination involves using a trend indicator like the 50-period EMA to determine market direction, RSI to identify momentum conditions, and Bollinger Bands to time entries. In this system, traders might look for long opportunities when price is above the 50 EMA (trend confirmation), RSI shows oversold conditions below 30 (momentum setup), and price touches the lower Bollinger Band (timing signal). This three-step confirmation process significantly improves trade quality compared to using any single indicator alone.
The concept of timeframe confluence adds another layer of confirmation to indicator combinations. Professional traders often analyze multiple timeframes simultaneously, looking for situations where indicators align across different time horizons. For example, a daily chart showing an uptrend with MACD above zero, combined with a 4-hour chart RSI pullback to oversold levels, creates a high-probability long setup when the 1-hour chart shows reversal signals.
Risk management improves dramatically when using multiple indicators for confirmation. Rather than risking the same amount on every trade, experienced traders adjust position sizes based on the strength of confluence. Trades with confirmation from multiple indicators and timeframes warrant larger position sizes, while weaker setups deserve smaller allocations or complete avoidance.
The key to successful indicator combination is maintaining simplicity while adding confirmation layers. Many traders make the mistake of adding more and more indicators to their charts, creating analysis paralysis and contradictory signals. A well-designed system typically uses three to five complementary indicators that provide different types of market information without overwhelming the decision-making process.
Backtesting indicator combinations helps identify the most effective setups and parameter combinations for your trading style and preferred currency pairs. Historical testing reveals which indicator combinations produce the highest win rates, best risk-reward ratios, and most consistent performance across different market conditions. This data-driven approach prevents emotional decision-making and builds confidence in your trading system.
Common Mistakes When Using MT4 Indicators
Even experienced traders can fall into indicator-related traps that undermine their trading performance. Understanding these common mistakes helps you avoid the pitfalls that derail many otherwise capable traders and develop a more professional approach to technical analysis.

The most prevalent mistake involves over-relying on indicators while ignoring raw price action. Indicators are mathematical derivatives of price, meaning they lag behind actual market movement. Traders who focus exclusively on indicator signals often miss important price patterns, support and resistance breaks, and market context that could improve their timing and decision quality. The most successful approaches combine indicator analysis with clean price action reading.
Analysis paralysis represents another significant challenge, particularly for traders new to technical analysis. Adding multiple indicators to charts often creates conflicting signals, with one tool suggesting a buy while another indicates a sell. This confusion leads to indecision, missed opportunities, and reduced confidence in the trading system. Professional traders typically limit themselves to three to five complementary indicators that work together harmoniously.
Chasing signals without proper risk management destroys more trading accounts than any other single factor. Indicators can generate compelling signals, but without appropriate position sizing, stop-loss placement, and profit targets, even accurate predictions can result in losses. Every trade should have predefined risk parameters regardless of how confident the indicator signals appear.
Many traders make the mistake of using indicators designed for trending markets during ranging conditions, and vice versa. Momentum oscillators like RSI and Stochastic perform poorly in strong trends, generating premature reversal signals that lead to losses. Similarly, trend-following indicators like moving averages produce excessive false signals during sideways markets. Successful trading requires matching indicator selection to current market conditions.
Ignoring the broader market context while focusing solely on indicator signals leads to poor timing and unnecessary losses. A perfect RSI divergence setup loses its value if it occurs against the direction of a strong daily trend or during high-impact news events. Professional traders always consider multiple timeframes, economic calendars, and overall market sentiment when evaluating indicator signals.
Backtesting mistakes can provide false confidence in trading systems that won’t perform in live markets. Common errors include curve-fitting parameters to historical data, ignoring transaction costs and slippage, and testing on insufficient data samples. Robust backtesting requires out-of-sample testing, realistic cost assumptions, and validation across different market conditions and time periods.
Finally, many traders expect indicators to work immediately and perfectly, abandoning effective tools after a few losing trades. All indicators experience periods of reduced effectiveness, and even the best systems have losing streaks. Success requires patience, discipline, and the emotional fortitude to stick with proven methods through inevitable rough patches.
Advanced MT4 Indicator Strategies
Professional traders develop sophisticated strategies that combine multiple indicators with advanced market concepts to create robust trading systems. These strategies go beyond basic signal interpretation to incorporate market structure analysis, multiple timeframe confirmation, and dynamic risk management techniques.
Scalping
Scalping strategies require indicators that respond quickly to price changes while filtering out market noise. Successful scalpers often combine fast EMAs (5 and 13 periods) with Stochastic oscillator and volume indicators on 1-minute and 5-minute charts. The key lies in identifying micro-trends within larger market movements and capturing small but frequent profits with tight risk control.
A proven scalping approach involves waiting for the 5 EMA to cross above the 13 EMA while Stochastic shows oversold conditions recovering above 20. Entry occurs on the next candle open, with stops placed below the recent swing low and targets set at 1.5 to 2 times the risk. This strategy works best during active trading sessions when market volatility provides sufficient movement for profitable scalping opportunities.
Swing trading
Swing trading strategies focus on capturing larger price movements over several days to weeks using daily and 4-hour chart analysis. Effective swing trading combines trend identification on daily charts with precise timing using shorter timeframes. A popular approach uses the daily 50 EMA as a trend filter, only taking long positions when price remains above this level and short positions when below.
For swing trade entries, traders often wait for pullbacks to the 20 EMA on 4-hour charts, confirmed by RSI showing oversold conditions below 35. Additional confirmation comes from price testing previous support or resistance levels that align with Fibonacci retracement levels. This multi-layer confirmation process significantly improves trade quality while maintaining favorable risk-reward ratios.
Trend-following
Trend following strategies capitalize on sustained directional moves by combining multiple trend indicators across different timeframes. A robust trend-following approach might use weekly charts to identify primary trends, daily charts for trade direction, and 4-hour charts for entry timing. This pyramid approach ensures alignment with the strongest market forces while providing precise entry points.
The ADX indicator plays a crucial role in trend-following systems by measuring trend strength and filtering out low-probability trades during consolidation periods. Combined with directional movement indicators (+DI and -DI), ADX helps traders stay in profitable trends longer while avoiding whipsaw losses during sideways markets. Many successful trend followers only take trades when ADX exceeds 25 and shows rising momentum.
Counter-trend
The counter trend strategies require exceptional timing and risk management skills, as they involve trading against established market direction. These strategies work best during overbought or oversold conditions in strong trends, using momentum oscillators to identify potential reversal points. RSI divergence combined with Bollinger Band extremes often provides high-probability counter-trend opportunities.
Successful counter-trend trading requires multiple confirmations and tight risk control. Traders typically wait for price to reach extreme Bollinger Band levels while RSI shows divergence, then look for reversal candlestick patterns for entry timing. Stops are placed beyond recent extremes, while targets focus on mean reversion to moving averages or mid-Bollinger Band levels.
Multiple timeframe analysis
Multi timeframe analysis elevates any indicator strategy by providing context and confirmation across different time horizons. Professional traders typically analyze at least three timeframes: a higher timeframe for trend identification, a middle timeframe for signal generation, and a lower timeframe for precise entry timing. This approach significantly improves trade quality while reducing false signals.
For example, a trader might use weekly charts to identify the primary trend direction, daily charts to spot potential trade setups using MACD and RSI, and 4-hour charts for entry timing using price action and moving average support or resistance. This systematic approach ensures alignment with multiple market cycles while maintaining precise execution.
Creating Your Own MT4 Indicator Strategy
Developing a personalized indicator strategy requires systematic testing, careful documentation, and continuous refinement based on real market performance. The process begins with clearly defining your trading objectives, risk tolerance, and available time for market analysis.
Start by selecting indicators that complement your personality and trading style. Aggressive traders might prefer fast-moving indicators like short-period EMAs and sensitive oscillators, while conservative traders often favor longer-period moving averages and less sensitive momentum tools. The key is finding indicators that match your emotional temperament and decision-making preferences.
Backtesting forms the foundation of strategy development, but it must be conducted properly to provide meaningful results. Use at least two years of historical data across different market conditions, including trending and ranging periods. Test your strategy on multiple currency pairs to ensure robustness across different market characteristics. Document all parameters, rules, and results meticulously to identify patterns and areas for improvement.
Paper trading provides the crucial bridge between backtesting and live trading, allowing you to test your strategy in real market conditions without financial risk. Maintain detailed records of all paper trades, including entry reasons, exit rationales, and emotional responses to different market situations. This practice period helps identify psychological challenges and strategy refinements before risking real capital.
Performance measurement goes beyond simple win-loss ratios to include risk-adjusted returns, maximum drawdown, and consistency metrics. The Sharpe ratio measures risk-adjusted returns, while maximum drawdown reveals the largest peak-to-trough loss your strategy might experience. These metrics help you understand whether your strategy’s returns justify its risks and whether you can psychologically handle its worst-case scenarios.
Continuous strategy refinement involves regular review and optimization based on changing market conditions. Markets evolve, and strategies that worked well in the past may become less effective over time. Monthly performance reviews help identify when adjustments are needed and whether current market conditions favor your approach.
Document everything in a comprehensive trading plan that includes entry and exit rules, risk management parameters, position sizing formulas, and performance benchmarks. This written plan serves as your roadmap during emotional market periods and helps maintain consistency when market stress threatens to derail your discipline.
MT4 vs MT5 Indicators: Key Differences
While MetaTrader 4 remains the most popular forex trading platform, MetaTrader 5 offers enhanced capabilities that affect indicator functionality and availability. Understanding these differences helps traders make informed decisions about platform selection and indicator usage.
MT5 includes all MT4 indicators plus additional tools designed for multi-asset trading. The newer platform supports more timeframes (21 vs MT4’s 9), enabling more precise analysis and better multiple timeframe strategies. MT5 also provides more sophisticated order types and execution modes that can enhance indicator-based trading strategies.
The programming language differences between MQL4 and MQL5 mean that custom indicators designed for one platform typically don’t work on the other without modification. However, MT5’s more advanced programming capabilities enable more sophisticated indicator calculations and features like multi-symbol analysis and enhanced alert systems.
Performance differences favor MT5, particularly for strategies using multiple indicators simultaneously or analyzing multiple currency pairs. The newer platform’s improved memory management and processing speed become apparent when running complex indicator combinations or conducting extensive backtesting operations.
Migration considerations include indicator compatibility, familiar interface elements, and broker support. Many custom MT4 indicators have MT5 versions available, but some specialized tools remain exclusive to MT4. Additionally, some brokers offer different spreads or execution quality between platforms, factors that can impact indicator-based strategy performance.
Conclusion
Mastering MT4 indicators requires patience, practice, and a systematic approach to learning and implementation. The tools discussed in this guide provide a solid foundation for technical analysis, but remember that indicators are just one component of successful trading. They work best when combined with solid risk management, emotional discipline, and continuous learning.
The key to indicator success lies not in finding the “holy grail” combination but in developing a deep understanding of how different tools work together under various market conditions. Start with simple combinations, test them thoroughly, and gradually add complexity as your experience grows. Focus on consistency rather than complexity, and always prioritize risk management over signal accuracy.
Market conditions constantly evolve, and successful traders adapt their indicator usage accordingly. Stay curious, keep learning, and don’t be afraid to adjust your approach when market characteristics change. The indicators that served you well in trending markets may need modification during ranging periods, and vice versa.
Remember that behind every indicator is a mathematical formula designed to process market data. Understanding the logic behind your chosen indicators helps you use them more effectively and avoid common interpretation mistakes. Take time to learn how each indicator is calculated and what market conditions favor its signals.
Your trading success ultimately depends on how well you can combine technical analysis with proper risk management and emotional control. Use indicators as tools to guide your decisions, not as replacements for critical thinking and market awareness. The most profitable traders are those who understand both the power and limitations of technical analysis.
Ready to take your trading to the next level? Start by selecting two or three indicators from this guide and spending the next month mastering their signals and combinations. Document your observations, test different settings, and gradually build your expertise one tool at a time. Share your experiences and questions in the comments below – the trading community learns best when we share knowledge and support each other’s growth.
Frequently Asked Questions
What are the most accurate MT4 indicators for forex trading?
No single indicator is universally accurate, as market conditions constantly change. However, moving averages, RSI, and MACD have proven their effectiveness over decades of use. The key to accuracy lies in combining multiple indicators for confirmation rather than relying on any single tool. Professional traders typically achieve better results by matching indicator selection to current market conditions, using trend-following indicators during trending periods and oscillators during ranging markets.
How many indicators should I use on my MT4 charts?
Most successful traders use between three to five indicators to avoid analysis paralysis while maintaining sufficient confirmation. The optimal number depends on your trading style, experience level, and the specific indicators chosen. Beginners should start with two complementary indicators, such as a trend indicator and an oscillator, before gradually adding more tools as they develop experience. Quality of analysis matters more than quantity of indicators.
Can MT4 indicators predict future price movements with certainty?
No indicator can predict future price movements with absolute certainty, as forex markets are influenced by countless variables including economic events, geopolitical developments, and trader sentiment. Indicators provide probability-based insights into potential market direction based on historical patterns and mathematical calculations. Successful trading involves managing probabilities and risks rather than seeking guaranteed predictions.
Are free MT4 indicators as good as paid ones?
Many free MT4 indicators offer excellent functionality that rivals expensive commercial alternatives. The MQL5 community and established forex forums provide access to high-quality free tools created by experienced programmers and traders. However, paid indicators often include additional features like customer support, regular updates, and comprehensive documentation. The key is evaluating indicators based on functionality and reliability rather than price alone.
How do I know if an MT4 indicator is working correctly?
Test indicators using historical data to verify they produce expected signals under known market conditions. Compare indicator readings with manual calculations when possible, and cross-reference signals with other analytical tools. Properly functioning indicators should generate logical signals that align with observable price patterns and market behavior. If an indicator produces erratic or contradictory signals, check installation, settings, and data feed quality before concluding it’s defective.