
The MetaTrader 5 platform offers an impressive arsenal of both built-in and custom indicators, each designed to help you decode market behavior from different angles. From simple moving averages that reveal trend direction to sophisticated oscillators that identify overbought and oversold conditions, these tools have become indispensable for modern forex traders. In this comprehensive guide, we’ll explore everything you need to know about MT5 indicators, from the fundamentals to advanced strategies that can elevate your trading performance.
Understanding MT5 Indicators Fundamentals
Before diving into specific indicators, it’s crucial to understand what MT5 indicators actually are and how they fit into your trading strategy. At their core, indicators are mathematical calculations based on historical price, volume, or open interest data. They help traders interpret market conditions and make informed decisions by filtering out market noise and highlighting potential opportunities.

Think of indicators as your market translators. Raw price action can be chaotic and difficult to interpret, especially for newer traders. Indicators take this complex information and present it in a more digestible format through lines, histograms, and oscillating patterns on your charts. This visual representation makes it easier to spot patterns, trends, and potential reversal points that might otherwise be missed in the constant flow of price movements.
The MetaTrader 5 platform represents a significant evolution from its predecessor, MT4, offering enhanced analytical capabilities and more sophisticated indicator options. While MT4 remains popular among many traders, MT5 provides superior backtesting features, more timeframes, and advanced order management capabilities that complement its extensive indicator library. The platform supports multiple asset classes beyond forex, including stocks, commodities, and cryptocurrencies, making it a versatile choice for diversified traders.
MT5 indicators generally fall into four main categories, each serving a specific analytical purpose. Trend indicators help identify the direction and strength of market movements, making them ideal for trend-following strategies. Oscillators excel at identifying overbought and oversold conditions, particularly useful in ranging markets. Volume indicators analyze trading activity to confirm price movements and identify potential breakouts. Finally, volatility indicators measure market volatility levels, helping traders adjust their risk management and position sizing accordingly.
The key to successful indicator usage lies in understanding that no single indicator provides a complete picture of market conditions. Professional traders typically combine multiple indicators from different categories to create a comprehensive analytical framework. This approach, known as confluence trading, helps reduce false signals and increases the probability of successful trades.
Essential Built-in MT5 Indicators Every Trader Should Know
The beauty of MetaTrader 5 lies in its extensive library of built-in indicators that require no additional downloads or installations. These time-tested tools form the foundation of technical analysis for

millions of traders worldwide, and mastering them is essential for anyone serious about forex trading success.
Moving averages represent perhaps the most fundamental and widely used MT5 indicators. The Simple Moving Average smooths out price data over a specified period, helping traders identify trend direction and potential support and resistance levels. When price trades above the moving average, it typically indicates an upward trend, while price below the moving average suggests a downward trend. The Exponential Moving Average gives more weight to recent price data, making it more responsive to current market conditions and better suited for fast-moving markets.
The magic of moving averages often comes from their crossovers. When a shorter-period moving average crosses above a longer-period average, it can signal the beginning of an upward trend. Conversely, when the shorter average crosses below the longer one, it may indicate a potential downward move. Many successful traders use the popular combination of 50-period and 200-period moving averages, with their crossover serving as a major trend change signal.
The MACD, or Moving Average Convergence Divergence, takes moving average analysis to the next level by showing the relationship between two moving averages of an asset’s price. The MACD line represents the difference between a fast exponential moving average and a slow exponential moving average, while the signal line is an exponential moving average of the MACD line itself. When the MACD line crosses above the signal line, it often indicates a bullish signal, while a cross below suggests bearish momentum.
Bollinger Bands create a dynamic channel around price action using a moving average and standard deviation calculations. The upper and lower bands expand and contract based on market volatility, providing valuable insights into potential price extremes. When prices touch or exceed the upper band, the market might be overbought, while touches of the lower band could indicate oversold conditions. The squeeze pattern, where bands contract significantly, often precedes major price movements as volatility is building up for release.
Among oscillators, the Relative Strength Index stands out as one of the most reliable MT5 indicators for identifying momentum shifts. The RSI oscillates between 0 and 100, with readings above 70 traditionally considered overbought and readings below 30 considered oversold. However, experienced traders know that these levels can vary depending on market conditions and trend strength. During strong uptrends, RSI might remain above 70 for extended periods, while strong downtrends can keep it below 30.
The Stochastic Oscillator provides another perspective on momentum by comparing closing prices to the trading range over a specific period. This indicator consists of two lines: %K and %D, with crossovers between these lines generating potential trading signals. When both lines are above 80, the market is considered overbought, while readings below 20 suggest oversold conditions. The beauty of the Stochastic lies in its ability to identify potential reversal points before they occur in price action.
Volume-based indicators add another dimension to your analysis by incorporating trading activity data. The On Balance Volume accumulates volume on up days and subtracts volume on down days, creating a running total that can confirm price trends or reveal potential divergences. When price makes new highs but OBV fails to follow, it might signal weakening buying pressure and a potential trend reversal.
Top Custom MT5 Indicators to Enhance Your Trading
While built-in indicators provide a solid foundation, custom MT5 indicators can take your analysis to the next level by offering specialized analytical tools and unique perspectives on market behavior. These indicators, developed by traders and programmers worldwide, often combine multiple analytical concepts or present familiar calculations in new, more intuitive ways.
Heiken Ashi represents one of the most popular custom indicators that transforms traditional candlestick charts into a smoother, trend-focused format. Unlike regular candlesticks that show actual open, high, low, and close prices, Heiken Ashi candles use modified calculations that filter out much of the market noise. Green candles typically indicate upward trends, while red candles suggest downward movements. The absence of lower shadows on green candles or upper shadows on red candles often signals strong trending conditions.
The power of Heiken Ashi lies in its ability to keep traders in trends longer by reducing the number of false reversal signals that plague traditional candlestick analysis. Many successful swing traders use Heiken Ashi charts to identify overall trend direction and then switch to regular candlesticks for precise entry and exit timing. This dual-chart approach combines the clarity of trend identification with the precision of conventional price action analysis.
Ichimoku Kinko Hyo, often simply called Ichimoku, provides a comprehensive analytical system that includes multiple components working together to create a complete market picture. The indicator consists of five lines and a cloud formation that provides support and resistance levels, trend direction, and momentum information all in one visual package. When price trades above the cloud, the overall trend is considered bullish, while price below the cloud suggests bearish conditions.
The Ichimoku system excels in trending markets and provides excellent guidance for position sizing and risk management. The cloud’s thickness indicates trend strength, with thicker clouds representing stronger trends. Many professional traders use Ichimoku across multiple timeframes, analyzing the daily chart for overall direction and using shorter timeframes for entry timing.
Fibonacci retracement tools, while not technically indicators in the traditional sense, represent essential custom additions to any trader’s analytical toolkit. These tools help identify potential support and resistance levels based on the mathematical relationships discovered by Leonardo Fibonacci centuries ago. The most commonly used retracement levels are 23.6%, 38.2%, 50%, 61.8%, and 78.6%, with the 38.2% and 61.8% levels often providing the strongest support or resistance.
Successful traders use Fibonacci retracements to identify potential entry points during pullbacks in trending markets. When a currency pair is in an uptrend and begins to retrace, traders often look for buying opportunities near the 38.2% or 61.8% retracement levels, expecting the trend to resume. The key is combining Fibonacci levels with other forms of analysis, such as support and resistance zones or candlestick patterns, to increase the probability of successful trades.
Pivot points provide another valuable custom indicator that automatically calculates daily, weekly, or monthly support and resistance levels based on the previous period’s high, low, and close prices. These levels often act as psychological barriers where price may reverse or consolidate, making them valuable for both day traders and swing traders. Many institutional traders watch pivot points closely, creating self-fulfilling prophecies when price approaches these levels.
The MT5 Market and MQL5 Community serve as excellent sources for finding high-quality custom indicators. The MT5 Market offers both free and paid indicators that have been reviewed and tested by the community, while the MQL5 Community provides a platform for developers to share their creations and for traders to request custom indicators. When choosing custom indicators, it’s important to read reviews, understand the indicator’s logic, and test it thoroughly on a demo account before using it in live trading.
Installing and Using MT5 Indicators Like a Pro
Mastering the installation and configuration of MT5 indicators is crucial for optimizing your trading setup and ensuring you can quickly access the analytical tools you need. The process might seem daunting at first, but with the right approach, you’ll soon be installing and customizing indicators like a seasoned professional.
Installing built-in indicators in MT5 is refreshingly straightforward. The Navigator panel, located on the left side of your platform by default, contains a comprehensive list of all available built-in indicators organized by category. To add an indicator to your chart, simply locate it in the Navigator, drag it onto your desired chart, and release. A settings dialog will appear, allowing you to customize parameters such as periods, colors, and calculation methods before applying the indicator.
The beauty of this drag-and-drop approach is its simplicity, but don’t let that fool you into skipping the configuration step. Each indicator comes with default settings that may not be optimal for your trading style or the specific currency pair you’re analyzing. Take time to understand what each parameter does and experiment with different settings to find what works best for your strategy. Many successful traders spend considerable time optimizing their indicator settings through backtesting and forward testing on demo accounts.
Custom indicator installation requires a few additional steps but opens up a world of analytical possibilities. When you download a custom indicator, it typically comes as an EX5 file for MT5. To install it, you need to place this file in the correct folder within your MT5 installation directory. Navigate to File menu, select Open Data Folder, then go to MQL5 and finally to Indicators folder. Copy your custom indicator file into this directory, and then restart MT5 or refresh the Navigator panel to see your new indicator appear in the Custom Indicators section.
For indicators that come as MQ5 source code files, you’ll need to compile them first. This process converts the human-readable code into executable format that MT5 can use. Place the MQ5 file in the Indicators folder, then open the MetaEditor from within MT5, load your indicator file, and compile it. Any compilation errors will be displayed, and successful compilation will create the EX5 file needed for the indicator to function.
Customizing indicator appearance and behavior can significantly impact your trading effectiveness. Most indicators allow you to modify colors, line styles, and thickness to match your visual preferences and chart theme. More importantly, you can adjust calculation parameters to suit different market conditions or timeframes. For example, a 14-period RSI might work well for daily charts, but you might prefer a 21-period RSI for longer-term analysis.
Alert configuration represents one of the most powerful features of MT5 indicators. Many indicators can be set to notify you when specific conditions are met, such as when RSI enters overbought territory or when moving averages cross. These alerts can be delivered as sound notifications, pop-up messages, email alerts, or even push notifications to your mobile device. Setting up intelligent alerts allows you to monitor multiple currency pairs simultaneously without constantly watching your screens.
Template creation and management can save you enormous amounts of time when switching between different analytical setups. Once you’ve configured your indicators exactly as you want them, save the setup as a template through the Charts menu. You can create different templates for different market conditions, trading strategies, or timeframes, allowing you to quickly switch your analytical focus as market conditions change.
Proven MT5 Indicator Strategies for Consistent Profits
Developing profitable trading strategies using MT5 indicators requires understanding how different indicators complement each other and creating systematic approaches that can be consistently executed. The most successful traders don’t rely on gut feelings or random indicator combinations; they develop tested methodologies that provide clear entry and exit signals while managing risk effectively.

The moving average crossover strategy represents one of the most enduring and reliable approaches to trend trading. This strategy typically involves using two moving averages of different periods, such as a 20-period and 50-period exponential moving average. When the faster moving average crosses above the slower one, it signals a potential upward trend and buying opportunity. Conversely, when the faster average crosses below the slower one, it indicates a potential downward trend and selling opportunity.
The elegance of this strategy lies in its simplicity, but successful implementation requires understanding its nuances. Not all crossovers result in profitable trends, particularly in sideways markets where whipsaws can generate multiple false signals. Experienced traders often add filters to improve signal quality, such as waiting for confirmation candles after the crossover or requiring minimum distance between the moving averages before considering a signal valid.
Risk management becomes crucial with trend-following strategies like moving average crossovers. Since the strategy aims to capture large price movements, initial stop losses are often placed beyond recent swing highs or lows, potentially resulting in larger individual losses. However, the strategy compensates by allowing winning trades to run for extended periods, creating favorable risk-reward ratios when properly executed.
RSI divergence strategies focus on identifying momentum shifts before they become apparent in price action. Bullish divergence occurs when price makes lower lows while RSI makes higher lows, suggesting weakening selling pressure and potential upward reversal. Bearish divergence happens when price makes higher highs while RSI makes lower highs, indicating weakening buying pressure and potential downward reversal.
Trading divergences requires patience and precise timing, as divergences can persist for extended periods before price follows momentum. Successful divergence traders often wait for additional confirmation signals, such as candlestick reversal patterns or break of trend lines, before entering positions. The key is understanding that divergences indicate potential reversals, not guaranteed ones, and managing positions accordingly.
Multi-indicator confirmation strategies combine signals from different types of indicators to increase trade probability and reduce false signals. A popular combination involves using trend-following indicators like moving averages to determine overall direction, oscillators like RSI or Stochastic to time entries, and volume indicators to confirm signal strength. This layered approach helps ensure that multiple analytical perspectives align before taking positions.
For example, a comprehensive bullish setup might require price to be above the 50-period moving average (trend confirmation), RSI to be oversold but showing signs of turning higher (momentum timing), and volume to increase on the setup day (confirmation of interest). This multi-layered approach significantly reduces the number of trading opportunities but typically results in higher-quality signals with better success rates.
The Bollinger Bands squeeze strategy capitalizes on periods of low volatility that often precede significant price movements. When Bollinger Bands contract to very narrow ranges, it indicates decreasing volatility and building pressure for a substantial move. The strategy involves identifying these squeeze conditions and positioning for the eventual breakout in either direction.
Implementing the squeeze strategy requires patience and careful position management, as the breakout direction is unknown in advance. Some traders take positions in both directions during extreme squeezes, closing the losing side when direction becomes clear. Others wait for the initial breakout and then enter in the direction of the move, using additional indicators to confirm trend strength and sustainability.
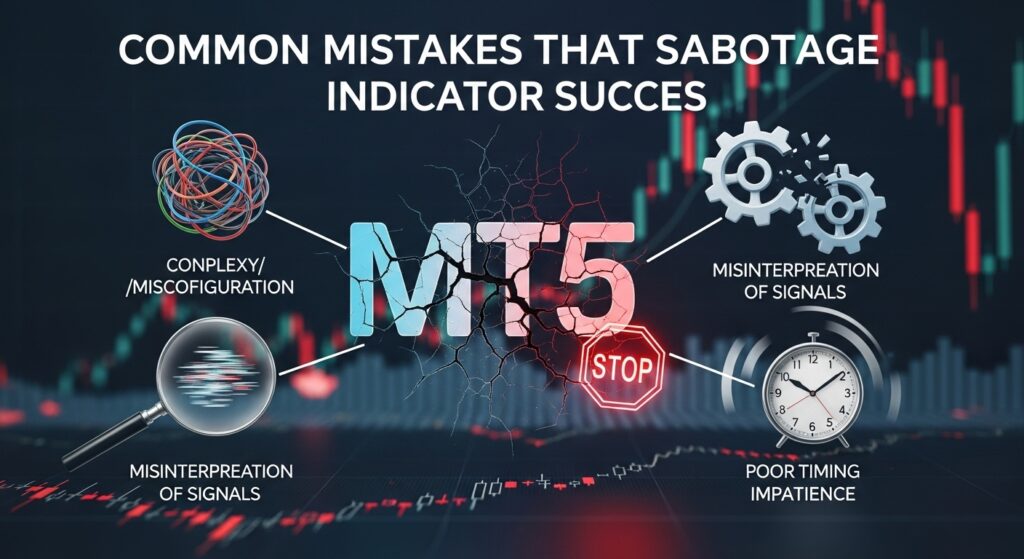
Common Mistakes That Sabotage MT5 Indicator Success
Understanding what not to do with MT5 indicators is often as important as knowing what to do. Many traders, especially beginners, fall into predictable traps that prevent them from realizing the full potential of technical analysis. Recognizing and avoiding these common mistakes can dramatically improve your trading results and help you develop more consistent profitability.
Over-reliance on indicators represents perhaps the most fundamental error in technical analysis. While indicators provide valuable insights into market behavior, they are tools that should inform decision-making, not replace critical thinking and market awareness. Indicators are based on historical data and therefore lag behind current price action. They cannot predict the future with certainty, and blindly following indicator signals without considering broader market context often leads to disappointing results.
Successful traders use indicators as part of a comprehensive analytical framework that includes price action analysis, fundamental factors, market sentiment, and risk management. They understand that indicators work best when they confirm what price action is already suggesting, rather than serving as the primary basis for trading decisions. This balanced approach prevents the mechanical trading mentality that often leads to consistent losses.
The phenomenon of analysis paralysis affects many traders who add too many indicators to their charts in an attempt to achieve perfect market timing. Charts cluttered with multiple indicators often provide conflicting signals, creating confusion rather than clarity. When five different indicators are telling you five different things, decision-making becomes nearly impossible, and opportunities pass while you’re trying to reconcile contradictory information.
Professional traders typically use a maximum of three to four indicators, ensuring each serves a specific purpose and provides unique information. They might use one trend indicator to determine overall direction, one oscillator for timing entries, and one volume or momentum indicator for confirmation. This streamlined approach provides comprehensive market analysis while maintaining clarity and actionability in signal interpretation.
Parameter optimization mistakes often stem from the misconception that there are magic settings that work across all market conditions and timeframes. Many traders spend enormous amounts of time trying to find the perfect RSI period or moving average length, believing that slight adjustments will transform their results. While parameter optimization has its place, over-optimization often leads to curve-fitted systems that work well historically but fail in real-time trading.
The reality is that market conditions constantly change, and indicator settings that work well in trending markets may perform poorly in ranging conditions. Instead of searching for perfect parameters, successful traders focus on understanding how different market environments affect their indicators and adjust their interpretation accordingly. They might use the same RSI settings but interpret overbought and oversold levels differently depending on whether the market is trending or consolidating.
Ignoring market context represents another critical error that undermines indicator effectiveness. Economic announcements, central bank meetings, geopolitical events, and seasonal factors all influence currency pair behavior and can temporarily override technical signals. Trading a textbook RSI oversold signal just before a major economic announcement often results in losses when the news moves the market against your position.
Developing market awareness involves understanding the economic calendar, recognizing seasonal patterns, and staying informed about major market themes. This doesn’t mean you need to become a fundamental analyst, but having basic awareness of significant market events helps you avoid taking technical signals at inappropriate times and adjust your risk management accordingly.
The lag inherent in indicator calculations creates another source of confusion for many traders. Since indicators are mathematical calculations based on past price data, they necessarily lag behind current market action. This lag means that by the time an indicator gives a signal, some of the price move has already occurred. Understanding this limitation helps set appropriate expectations and prevents frustration when indicators don’t provide signals at exact turning points.
Advanced MT5 Indicator Techniques for Professional Results
Taking your MT5 indicator usage to professional levels requires understanding advanced techniques that go beyond basic signal interpretation. These methods separate consistently profitable traders from those who struggle to achieve sustainable results, focusing on sophisticated approaches to signal confirmation, risk management, and systematic strategy development.
Multi-timeframe analysis represents one of the most powerful advanced techniques available to MT5 users. This approach involves analyzing the same currency pair across multiple timeframes to gain a comprehensive understanding of trend structure and potential trade opportunities. The concept is based on the principle that longer timeframes provide context and direction, while shorter timeframes offer precise entry and exit timing.
A typical multi-timeframe approach might involve analyzing the daily chart to determine overall trend direction, using 4-hour charts to identify intermediate-term patterns and key levels, and employing 1-hour charts for specific entry timing. This hierarchical analysis ensures that trades align with the dominant trend while providing multiple opportunities for position management and profit-taking.
The implementation of multi-timeframe analysis requires discipline and systematic approach. Many traders make the mistake of switching timeframes randomly or allowing shorter timeframe signals to override longer timeframe bias. Successful multi-timeframe traders establish clear rules about which timeframe takes precedence for different aspects of their trading decisions and stick to these rules consistently.
Advanced alert systems and automation can significantly improve your ability to monitor multiple currency pairs and trading opportunities simultaneously. MT5’s alert capabilities extend far beyond simple price notifications, allowing you to create sophisticated condition-based alerts that trigger only when multiple criteria are met. For example, you might set an alert that triggers only when RSI crosses above 30, price breaks above the 20-period moving average, and volume exceeds the 10-period average all within the same candle.
Creating effective alert systems requires careful consideration of signal quality versus quantity. Overly sensitive alerts that trigger frequently can become counterproductive, creating noise rather than highlighting genuine opportunities. The goal is to create alerts that identify high-probability setups while filtering out lower-quality signals that don’t meet your trading criteria.
Template management and workspace organization become increasingly important as your analytical sophistication grows. Professional traders often maintain multiple chart templates optimized for different market conditions, trading strategies, or currency pair characteristics. A template for trending markets might emphasize trend-following indicators and longer timeframes, while a ranging market template might focus on oscillators and shorter-term patterns.
The key to effective template management is consistency and purposefulness. Each template should serve a specific analytical function and be optimized for particular market conditions. Avoid the temptation to create too many templates, as this can lead to confusion and inconsistent analysis. Most professional traders maintain three to five core templates that cover their primary analytical needs.
Indicator combination strategies require understanding how different indicators complement and confirm each other. Rather than simply adding more indicators to charts, advanced practitioners focus on creating synergistic combinations where each indicator provides unique information that enhances the overall analytical picture. This might involve combining a trend indicator with a momentum oscillator and a volume-based confirmation tool.
The development of custom indicator combinations often involves extensive backtesting and forward testing to validate effectiveness across different market conditions. This process requires patience and systematic record-keeping but ultimately leads to more robust and reliable trading systems. Many professional traders spend months or even years developing and refining their indicator combinations before implementing them in live trading.
Advanced risk management integration involves using indicators not just for entry signals but also for position sizing and risk assessment. Volatility indicators like Average True Range can inform position sizing decisions, with smaller positions taken during high volatility periods and larger positions during stable conditions. Momentum indicators can guide stop-loss placement and profit-taking decisions, providing dynamic rather than static risk management approaches.
Performance Optimization and Troubleshooting
Maintaining optimal performance of your MT5 indicator setup is crucial for effective real-time trading and avoiding technical issues that can impact your analysis and decision-making. As you add more indicators and customize your analytical environment, understanding performance optimization and troubleshooting becomes increasingly important for maintaining smooth platform operation.
System resource management plays a critical role in MT5 performance, particularly when using multiple indicators across several charts. Each indicator performs calculations that consume CPU resources and memory, and the cumulative effect can slow down your platform or even cause crashes during high-activity trading periods. Understanding which indicators are resource-intensive and how to manage their impact ensures your trading platform remains responsive when you need it most.
Real-time indicators generally consume more resources than those that calculate only on closed bars. If you’re experiencing performance issues, consider adjusting indicator settings to reduce calculation frequency or switching to indicators that update less frequently. Many successful traders use a combination of real-time indicators for active positions and historical indicators for overall market analysis, balancing responsiveness with system performance.
Memory optimization becomes particularly important when running multiple chart layouts or monitoring numerous currency pairs simultaneously. MT5 stores indicator data in memory, and complex indicators with long calculation periods can consume significant amounts of RAM. Regular platform restarts, especially after heavy trading sessions or significant market events, can help clear memory and maintain optimal performance.
Chart loading and refresh speeds directly impact your ability to analyze markets efficiently and respond to trading opportunities. Heavy indicator loads can cause delays when switching between charts or timeframes, potentially causing you to miss important market developments. Optimizing your indicator selection and settings for each specific analytical purpose helps maintain chart responsiveness while preserving analytical capability.
Common installation and display issues often arise from incorrect file placement, compatibility problems, or corrupted indicator files. When custom indicators fail to display correctly or produce unusual calculations, the first troubleshooting step involves verifying that files are in the correct directories and that the platform has been restarted after installation. Many installation issues stem from placing EX5 files in the wrong subdirectory or failing to refresh the Navigator panel after adding new indicators.
Compilation errors with MQ5 source code files often result from version compatibility issues or missing dependencies. The MT5 platform periodically updates its programming language, and older custom indicators may require modifications to work with newer platform versions. When encountering compilation errors, checking the MQL5 community forums often provides solutions or updated versions of popular indicators.
Display and scaling issues can affect indicator readability and accuracy, particularly on high-resolution monitors or when using multiple monitor setups. MT5’s scaling options help address these issues, but some custom indicators may not scale properly, requiring manual adjustment of line thickness, colors, or text sizes. Understanding how to modify indicator display properties ensures your analytical tools remain clearly visible and functional across different display configurations.
Performance monitoring tools within MT5 provide insights into platform resource usage and can help identify indicators or configurations that are causing performance problems. The terminal’s Journal tab logs system messages and errors that can provide clues about performance issues or indicator malfunctions. Regular monitoring of these logs helps identify potential problems before they significantly impact your trading activities.
System crash recovery procedures become important when dealing with complex indicator setups or during periods of extreme market volatility. Maintaining backup copies of your workspace configurations, custom indicators, and template files ensures you can quickly restore your analytical environment if system problems occur. Many professional traders maintain their indicator files and templates in cloud storage or on separate backup devices to prevent loss due to hardware failures or system corruption.
Conclusion: Mastering MT5 Indicators for Trading Success
The journey to mastering MT5 indicators is both challenging and rewarding, requiring dedication to learning, consistent practice, and the wisdom to understand that indicators are tools that enhance rather than replace sound trading judgment. Throughout this comprehensive guide, we’ve explored the fundamental concepts, practical applications, and advanced techniques that separate successful indicator users from those who struggle to achieve consistent results.
The key to long-term success with MT5 indicators lies in understanding their proper role within a comprehensive trading strategy. Indicators should serve as confirmation tools and analytical aids that support your market analysis, not as magic formulas that guarantee profitable trades. The most successful traders combine indicator analysis with price action reading, fundamental awareness, and disciplined risk management to create robust trading approaches that can adapt to changing market conditions.
Remember that becoming proficient with MT5 indicators is a gradual process that requires patience and persistence. Start with the basic built-in indicators, master their interpretation and application, and then gradually expand your toolkit with custom indicators and advanced techniques. This systematic approach builds a solid foundation of understanding while preventing the overwhelming confusion that often comes from trying to learn too many analytical tools simultaneously.
Continuous learning and adaptation remain essential for long-term success with technical analysis. Markets evolve, new analytical techniques develop, and your own trading style will mature over time. Stay connected with the trading community, continue experimenting with new indicators and strategies in demo environments, and maintain detailed records of what works and what doesn’t in your specific trading approach.
The MT5 platform’s extensive analytical capabilities provide everything you need to develop sophisticated trading strategies, but remember that the platform is only as effective as the trader using it. Focus on developing the discipline to follow your analytical signals consistently, the wisdom to recognize when market conditions don’t favor your approach, and the flexibility to adapt your methods as you gain experience and market conditions change.
Your journey with MT5 indicators doesn’t end here. Take action by opening a demo account if you haven’t already, and begin implementing the strategies and techniques discussed in this guide. Start with simple approaches, document your results, and gradually increase complexity as your understanding and confidence grow. The path to trading success is unique for each individual, but the tools and knowledge provided here give you a solid foundation for that journey.
Frequently Asked Questions About MT5 Indicators
What’s the difference between MT4 and MT5 indicators, and should I switch platforms?
MT5 indicators offer several advantages over MT4, including more timeframes (21 vs 9), better backtesting capabilities, and support for multiple asset classes beyond forex. MT5 also provides improved order management and more sophisticated programming language for custom indicators. However, MT4 remains popular due to its simplicity and widespread broker support. The choice depends on your trading needs, but MT5 offers more advanced analytical capabilities for serious traders.
How many indicators should I use on my charts without causing analysis paralysis?
Most successful traders use 2-4 indicators maximum, ensuring each serves a specific purpose. A typical setup might include one trend indicator (like moving averages), one momentum oscillator (like RSI), and one confirmation tool (like volume or volatility indicator). The key is ensuring your indicators complement rather than duplicate each other’s information. More indicators don’t necessarily mean better analysis; clarity and actionable signals are more important than comprehensive coverage.
Are expensive custom MT5 indicators worth buying, or are free ones sufficient?
Free built-in MT5 indicators can provide everything needed for successful trading when properly understood and applied. Expensive custom indicators may offer unique features or presentations, but they don’t guarantee better results. Before purchasing any indicator, thoroughly test free alternatives and ensure you understand the analytical concept behind the tool. Many professional traders achieve consistent profits using only basic indicators like moving averages, RSI, and MACD.
Why do my MT5 indicators sometimes give conflicting signals, and how should I handle this?
Conflicting indicator signals are normal and occur because different indicators measure different aspects of market behavior. Trend indicators might show bullish signals while momentum oscillators show bearish readings, reflecting different timeframes or market conditions. Handle conflicts by understanding each indicator’s purpose, using higher timeframe analysis for context, and developing rules for which indicators take precedence in different market conditions. Consider reducing the number of indicators if conflicts become frequent.
How do I know if my MT5 indicator settings are optimized for my trading style?
Optimal indicator settings depend on your trading timeframe, risk tolerance, and market focus. Test different settings using historical data and demo trading, keeping records of results across various market conditions. Avoid over-optimization that creates perfect historical results but fails in live trading. Instead, focus on settings that provide consistent, actionable signals across different market environments. Many successful traders use standard settings (like 14-period RSI or 20/50 moving average crosses) and adapt their interpretation rather than constantly adjusting parameters.