
Binary Options Trading is simply a process of decision-making. How you do it and the tools you use to make those decisions are critical. Actually the best strategy for binary options trading is our mind but when we use our mind to make decisions we develop tools to help us decide what we will do, how we will do it, when we will do it. For example, we discussed the Elliott Wave Theory but there is no statistical data that shows counting waves actually works. Yes, there are times that you will get trades right but the same could be true of flipping a coin. The point is if our trading decision becomes interpretative at the point of the trade then our decision-making becomes much more complex. What kinds of decisions do you make when you trade binary options?
Here are just a few:
1. The currency pairs you are going to trade.
2. The time you are going to trade.
3. The system you are going to use.
4. What your signal will be when you trade.
5. Where will you place your entry?
6. What will your position size be?
7. What other factors will I take into consideration before I enter?
Those are just some of the decisions we make and within each of those decisions are multiple other decisions. We try to take these in logical steps but that doesn’t always work so tools become important for us to be able to reorganize our decision process when something happens we did not expect. Give me a choice between a binary options trader with sound decision-making and a good system and bad decision-making and great trading system and I will take the sound decision maker every time.

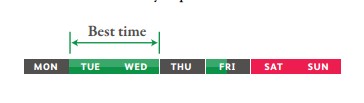
There are days that see more volatility and price action than others. According to research on binary options, Tuesday and Wednesday are considered to be the most active trading days of the week. Friday is also recognized as a high volatility trading day, especially during the hours when European and US trading sessions overlap. During the second half of the day, price movements can be very unpredictable.
Nearly every trader of Binary Options or Forex has heard of the Elliott Wave Theory and is probably fascinated by the concept. However despite its popularity, Elliott Wave is also the least correctly understood theory of technical analysis. Too many binary options traders have found the numerous rules behind Elliott Wave Theory to be overly complicated and subjective. For those who correctly understand the rules, Elliott Wave Theory has proven to be a reliable basis for interpreting and forecasting price action. For those who misinterpret the rules, incorrect forecasting will lead many to conclude that Elliott Wave Theory is obsolete. Nevertheless, many traders have used Elliott Wave Theory to successfully identify turning points in price action.
Elliott Waves Theory: The Basics
Developed by Ralph Nelson Elliott in the 1930s, Elliott Wave Theory was originally designed to forecast stock price movement. Overtime however, the theory has been applied to a variety of markets, particularly foreign exchange. Its higher popularity in the foreign exchange market stems from the fact that 80% of the volume in the FX market is speculative. This is important since waves are based upon mass psychology. Elliott Wave Theory is now a very popular analytical strategy frequently used by the technicians of leading investment banks and inter-market players and individual traders of both Forex and Binary Options..
The Elliott Wave Theory is founded on the notion that markets are not perfectly efficient. As a result, prices from one moment to the next are not random but rather subject to changes in overall investor behavior—changes that can be predictable with an understanding of mass psychology.
How to count Elliot Waves
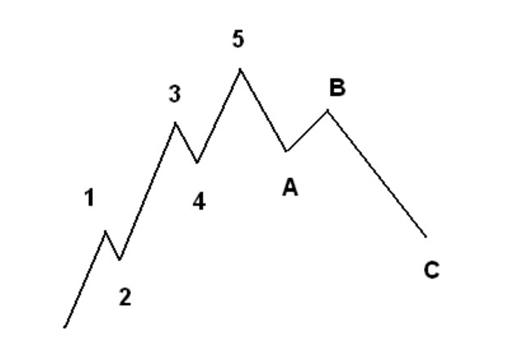
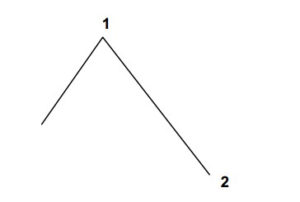
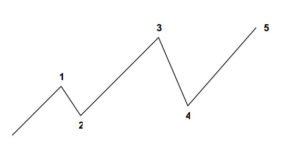
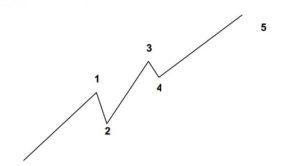
Before understanding the waves within the Theory, it is important to remember the tenet that every action creates an opposite reaction. Applying this thought to Elliott Wave, let us take a look at the most basic wave structure. The center of the Elliott Wave Theory rests on the idea that security prices move in waves: impulsive (going in the direction of the underlying trend) and corrective (going against the underlying trend). As indicated in the diagram below, there are 5 impulsive waves and 3 corrective waves. There are of course waves within waves that we will touch upon later in the guide.
Impulsive and Corrective Waves
To fully understand the Elliot Wave Theory, it is important to understand the psychological rationale for each of these waves since the zigzag movement of prices represents the ebb and flow of investor optimism and pessimism. Given an up trending market:
Wave 1 (Impulsive): Minor Up-wave In Major Bull Move – In Wave 1, prices rise as a relatively small number of market participants buy a currency pair for either fundamental or technical reasons, pushing prices higher.
Wave 2 (Corrective): Minor Down-wave In Major Bear Move – After a significant run-up, investors may get fundamental or technical signals indicating that the currency is overbought. At such time, Wave 2 develops when original buyers decide to take profits while newcomers initiate short positions. Price action reverses, but generally does not retrace beyond its initial low that attracted buyers at Wave 1.
Wave 3 (Impulsive): Minor Up-wave In Major Bull Move – Often the longest wave of the five, Wave 3 represents a sustained rally, as a larger number of investors use the Wave 2 dip as a buying opportunity. With a broader range of buyers, the security enjoys a stronger push higher, with prices extending beyond the top formed at Wave 1.
Wave 4 (Corrective): Minor Down-wave In Major Bear Move – By Wave 4, buyers begin to become exhausted and again take profits in reaction to overbought signals. Generally, there is still a fair amount of buyers, so the retracement here is relatively shallow.
Wave 5 (Impulsive): Minor Up-wave In Major Bull Move – Wave 5 represents the final move up in the sequence. At this point, buyers as a whole are motivated more by greed than any fundamental justifications to buy, and bid prices higher irrationally. Prices make a high for the move before a correction or reversal ensues. The high in Wave 5 often coincides with a divergence in the relative strength index (RSI).
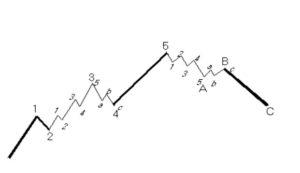
A-B-C Corrective Waves

Wave A: Correction to Rally – Initially Wave A may appear to be a correction to the normal rally. However, if it breaks down into five sub-waves, it indicates that a new market trend may have developed.
Wave B: Bear Market Correction – Wave B tends to give bears an opportunity to sell as others take profit on their short trades or exit their long positions.
Wave C: Confirms End of Rally – Wave C is the last wave of the cycle. At this point, Wave 3 typically breaks key support zones and most technical studies confirm that the rally has ended.
Wave Count Rules:
While determining waves can be extremely subjective, there are three rules to counting waves that always hold. These rules form the basic tenets of Elliott Wave Theory.
Rule 1: Wave 2 cannot retrace more than 100% of Wave 1
Violation of Rule 1:
Rule 2: Wave 4 cannot overlap Wave 1
Violation of Rule 2:
Rule 3: Of waves 1, 3, and 5, wave 3 can never be the shortest wave (it is, in fact, often the longest)
Violation of Rule 3:
Waves within Waves:
The primary reason why Elliott Wave Theory can be difficult to understand is because waves frequently occur at many different levels. In other words, there are minor waves within larger waves. That is why at many points in time, multiple correct wave interpretations usually exist. The major waves determine the direction of the trend, while the minor waves help to determine the minor trends. Used in conjunction, traders can apply Fibonacci ratios to Elliott Wave Theory to help determine when currencies will reach a top or bottom.
It can also be used as a tool to identify points to trade within the trend or to participate in the shorter minor wave cycles. It is important for Elliott Wave traders in Binary Options to be aware of both the minor and the major waves that may exist. The following is an example of two minor waves within larger waves:
Minimize Forecasting Errors with Elliott Waves:
Since many different waves can exist during the same time frame, increasing the risk of forecasting error, traders should follow certain rules to minimize risk. The most important of which is to follow the principle that the “the trend is your friend.” This means that it is more prudent to only look for opportunities sell into minor waves when the major wave is a downtrend and to buy when the major wave is an uptrend. More rules can be used though to determine levels for placing stop-loss orders or to exit the trade. Fibonacci ratios are one of the most useful ways of identifying possible peak or bottoms of wave cycles. A popular relationship that exists is that Wave 2 retraces 38% of Wave 1. 50% and 61.8% retracements are also frequently seen.

To succeed as a binary options trader, you have to get your conscious and sub conscience mind working for you. You must have a winning attitude, which can be achieved by surrounding yourself with positive events and introducing yourself to self-motivating or positive attitude tapes or books. Some call such ability an inherent feel for the market. Even better, they have the ability to act swiftly and execute a trading plan. I believe that these are talents that you develop and are not born with. Successful binary options traders were, are, and always will be students of the markets. They are achievers who continuously study, in perceptive detail, people’s actions, the processes of events, and the products in the markets they trade. When they place a trade, it is an educated decision, not merely a guess, and they know it. That knowledge gives them the confidence to execute and act on trading decisions. Confidence or thoroughly believing in yourself may come naturally or from the secure feeling you had when growing up.
Other ways to gain confidence in yourself might have come from overcoming an obstacle or having a successful experience in conquering some adversity in life. You consciously know that you have achieved or overcome challenges and can succeed due
to a past experience. Building confidence in yourself and in your binary options trading skills is extremely important in stimulating an optimistic winning attitude. The other common feature that successful traders seem to have is they are not afraid to be wrong. They realize that anticipating a market move will always include an element of risk. They act, not react, to market conditions. This means they place orders before the market moves rather than wait until after the market reacts to a situation or event. In my experience, those who hesitate or wait or are not prepared seem to have the most trouble capturing the element of success when it comes to trading futures.

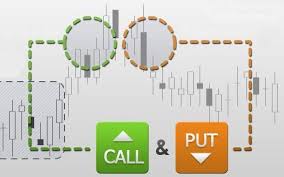
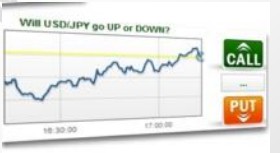
Several types of Binary Options can now be traded online using a variety of binary options trading strategies. This diversity in binary options types offers investors with different opportunities, and if fine-tuned, could be mastered and become profitable in the long term to the Binary Options trader. Some of them include; High/Low: The most commonly available binary options are “High/Low” also known as “Above” and “Below” or “Call/Put” binary options. Basically, a trader will receive a payout on a long binary option if the market is higher than the strike price of an above binary at expiration, or under the strike of a below binary.
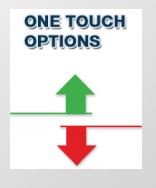
One Touch: Some online binary options trading platforms also offer “One Touch” above or below binary options that generate a payoff as soon as their trigger level trades in the underlying market… even before the expiration time.
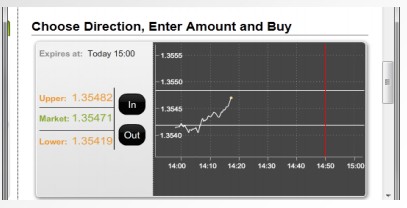
Boundary: Another popular type of binary option is the “Range or Boundary” binary that is characterized by a range that is compared to the underlying market at the option’s expiration. Typically, an ―in‖ range binary pays off if the market ends up inside the range, while an ―out range binary pays off if the market ends up outside the range.
Given the various types of binary options, it is important to go through all the ones available on the site you wish to trade on. Some brokers offer more diversified trading types compared to others. It is important to know what you are looking for in a binary options broker.