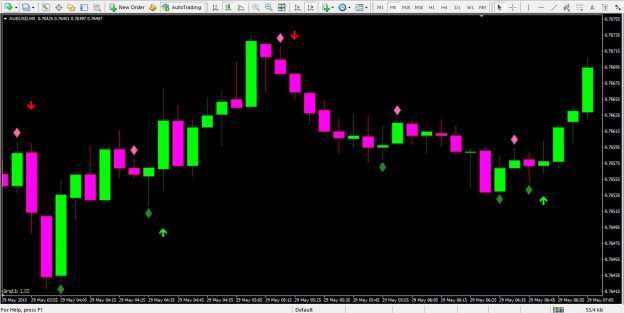
• Renko charts consist of brick-shaped bars, stood on end..
• Each brick represents x pips of movement up, or x pips of movement down. x is a
user input. In this picture, each brick is 10 pips. Renko charts are independent of time-frames. A new brick only starts when the previous
one has moved x pips. The yellow arrow is pointing towards a brick under formation. It
looks like the standard candle we are all used to seeing, because the price has to move a
full x pips (in this case 10) either up or down from its open price before it becomes a brick
and the next one forms.
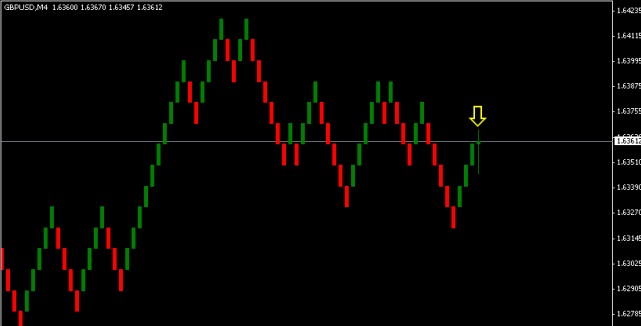
As illustrated, the bricks do not show the full extent of up and down movement in the price whilst they have been forming. It is possible to generate bricks that also show wicks. Whether to have, or not have, wicks is a personal choice that depends on what you are trying to do. The body of the brick always represents your choice of x pips movement
either up or down. Why do some binary options traders use Renko bricks? Primarily, this is because each brick represents solid movement in the direction of the brick.
• Rising bricks are only created when the market has moved x pips up from the close high of the previous one.
• Falling bricks are only created when the market has moved x pips down from the close-low of the previous one.
• The price has to move x times 2 (20 pips on this chart) for the bricks to change
colour. This means we are basing our trading decisions on pure price action; time does not come into the equation.
• In a quiet market, bricks will take a long time to form.
• In a rapidly-moving market, they will form quickly. Whether to have, or not have, wicks is a personal choice that depends on what you are trying to do.