The stochastic oscillator stands as one of the most reliable momentum indicators in a trader’s toolkit, developed by George Lane in the 1950s. This powerful technical analysis tool helps forex traders identify potential reversal points by comparing a currency pair’s closing price to its price range over a specific period. Understanding how to properly use the stochastic oscillator can mean the difference between catching profitable reversals and getting caught in false breakouts.
What is the Stochastic Oscillator?
The stochastic oscillator indicator operates on a fundamental principle that closing prices tend to close near the high during uptrends and near the low during downtrends. When this pattern begins to deteriorate, it often signals that momentum is shifting, potentially leading to a price reversal.
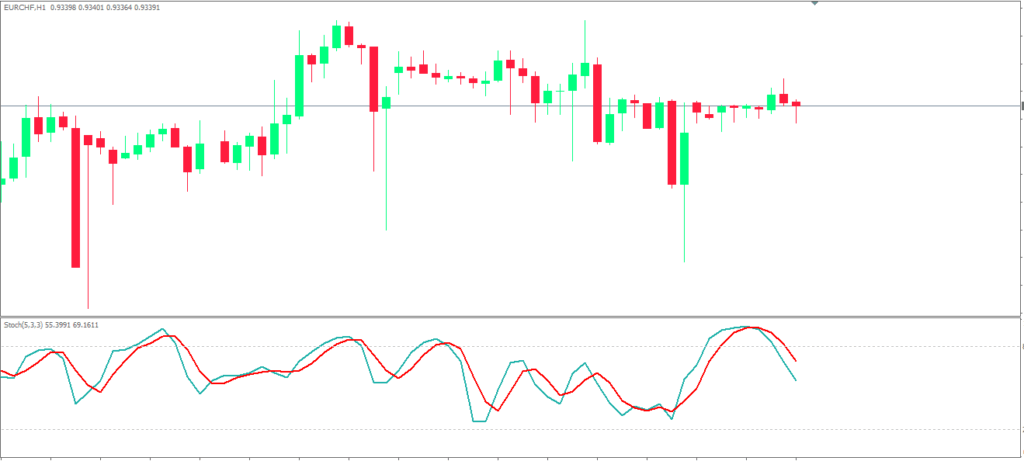
Think of the stochastic oscillator as a thermometer for market momentum. Just as a thermometer measures temperature on a scale, the stochastic measures momentum on a scale from 0 to 100. This bounded oscillator never ventures beyond these limits, making it particularly valuable for identifying extreme market conditions.
The indicator consists of two main lines that work together to provide trading signals. The %K line, known as the fast stochastic, represents the raw stochastic value calculated from the current price position within the recent price range. The %D line, or slow stochastic, is a three-period simple moving average of the %K line, which smooths out the indicator’s volatility and provides clearer signals for traders.
Understanding the Stochastic Formula
While you don’t need to calculate the stochastic oscillator manually thanks to modern trading platforms, understanding its construction helps you interpret its signals more effectively. The formula compares where the current closing price sits relative to the highest high and lowest low over a specific lookback period, typically 14 periods.
The beauty of this calculation lies in its simplicity and effectiveness. When a currency pair is trending upward strongly, closing prices naturally gravitate toward the recent highs, pushing the stochastic oscillator toward the upper range. Conversely, during strong downtrends, closing prices cluster near recent lows, driving the oscillator toward the lower range.
The %K line provides the immediate reading of momentum, while the %D line offers a smoother, more reliable signal by averaging the %K values. This dual-line system creates a powerful combination that helps traders distinguish between genuine momentum shifts and temporary market noise that can plague single-line indicators.
Critical Levels Every Trader Should Know
The stochastic oscillator indicator divides the 0-100 scale into three distinct zones, each carrying significant implications for forex traders. The overbought zone above 80 suggests that buying pressure may be exhausting itself, potentially leading to a downward price correction. However, remember that markets can remain overbought longer than your account can remain solvent, so timing becomes crucial.
The oversold zone below 20 indicates that selling pressure might be reaching extremes, often preceding upward price corrections. Many successful forex traders have learned to view these oversold conditions as potential buying opportunities, especially when combined with other technical confirmations.
The neutral zone between 20 and 80 represents balanced market conditions where neither buyers nor sellers have gained decisive control. While this zone might seem less exciting, it often provides the most reliable trend-following opportunities when the stochastic oscillator breaks out of these levels with conviction.
Understanding these zones helps you contextualize price action within the broader momentum framework. A currency pair making new highs while the stochastic oscillator remains below 80 suggests strong underlying momentum, while new highs accompanied by overbought stochastic readings might signal caution.
How to Read Stochastic Oscillator Signals
The stochastic oscillator generates several types of trading signals, each offering unique insights into market dynamics. Overbought and oversold reversals represent the most straightforward signals, occurring when the indicator reaches extreme levels and begins reversing direction. These signals work exceptionally well in ranging markets where currencies bounce between support and resistance levels.
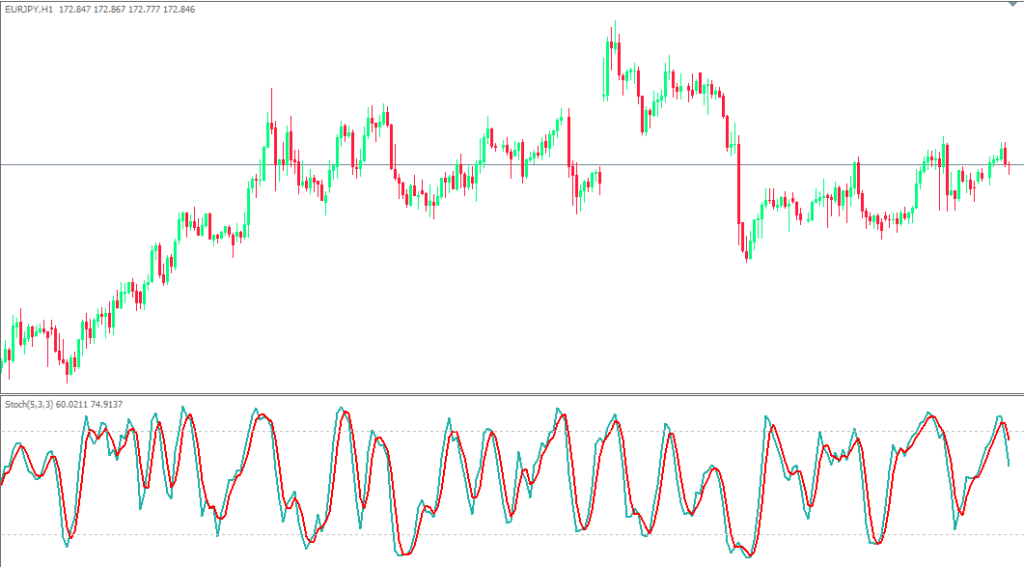
Crossover signals between the %K and %D lines provide another layer of analysis. When the faster %K line crosses above the slower %D line in oversold territory, it often signals the beginning of an upward momentum shift. Conversely, when %K crosses below %D in overbought territory, it frequently indicates the start of downward momentum.
Divergence patterns offer perhaps the most powerful stochastic oscillator signals, though they require more skill to identify correctly. Bullish divergence occurs when price makes lower lows while the stochastic oscillator makes higher lows, suggesting that selling pressure is weakening despite continued price declines. Bearish divergence presents the opposite scenario, with price making higher highs while the oscillator makes lower highs, indicating potential upward momentum exhaustion.
The key to successful signal interpretation lies in understanding market context. A stochastic oscillator crossover signal carries more weight when it aligns with major support or resistance levels, occurs after a significant price move, or coincides with other technical indicators pointing in the same direction.
Optimizing Your Stochastic Oscillator Setup
The default stochastic oscillator settings of 14, 3, 3 work well for most forex trading scenarios, representing fourteen periods for the %K calculation and three periods for the %D smoothing. However, successful traders often adjust these parameters based on their trading timeframe and market conditions.
Shorter-term traders might reduce the lookback period to 8 or 10 to create a more sensitive indicator that responds quickly to price changes. This approach generates more signals but also increases the likelihood of false positives. Longer-term position traders often extend the period to 21 or even 28 to filter out market noise and focus on more significant momentum shifts.
Combining the stochastic oscillator with other technical indicators creates a more robust trading system. Many professional forex traders pair stochastic signals with moving average crossovers, RSI confirmations, or support and resistance levels to increase signal reliability. This multi-indicator approach helps filter out false signals while maintaining the stochastic oscillator’s momentum insights.
Risk management becomes paramount when trading stochastic oscillator signals. Setting appropriate stop losses, typically below recent swing lows for buy signals or above recent swing highs for sell signals, protects your capital when signals fail to materialize as expected.
Stochastic Oscillator Trading Pitfalls
Even experienced traders can fall into common stochastic oscillator traps that erode trading performance. Relying solely on overbought and oversold levels without considering the broader trend context represents one of the most frequent mistakes. In strongly trending markets, the oscillator can remain in extreme zones for extended periods while prices continue moving in the trend direction.
Ignoring the underlying market trend when interpreting stochastic signals often leads to frustrating losses. The most profitable approach involves trading stochastic reversals against minor corrections within major trends, rather than trying to pick absolute tops and bottoms in trending markets.
Over-trading represents another significant pitfall, especially when the stochastic oscillator generates frequent signals in choppy market conditions. Quality always trumps quantity in forex trading, and waiting for high-probability setups with multiple confirmations typically produces better results than acting on every oscillator signal.
Impatience with signal confirmation can also undermine trading success. The most reliable stochastic oscillator signals often require waiting for the indicator to exit extreme zones and begin moving toward neutral territory, confirming that momentum has genuinely shifted rather than just pausing temporarily.
Master the Stochastic Oscillator
The stochastic oscillator indicator offers forex traders a reliable method for identifying momentum shifts and potential reversal points across all currency pairs and timeframes. Its ability to highlight overbought and oversold conditions, combined with crossover and divergence signals, makes it an invaluable addition to any trading strategy.
Success with the stochastic oscillator comes from understanding its strengths and limitations, properly interpreting its signals within market context, and combining it with sound risk management practices. Remember that no single indicator provides perfect signals, but the stochastic oscillator’s track record of identifying momentum extremes has helped countless traders improve their market timing.
Start incorporating the stochastic oscillator into your analysis today, but begin with demo trading to practice signal identification without risking real capital. As you gain experience with this powerful momentum indicator, you’ll develop the intuition needed to separate high-probability signals from market noise, ultimately enhancing your forex trading performance.
What’s your experience with momentum indicators? Share your thoughts on how the stochastic oscillator has impacted your trading journey, and don’t forget to subscribe to our newsletter for more technical analysis insights that can elevate your forex trading game.
Frequently Asked Questions
What is the best timeframe to use the stochastic oscillator indicator?
The stochastic oscillator works effectively across all timeframes, but the optimal choice depends on your trading style. Day traders often prefer 5-minute to 1-hour charts for quick signals, while swing traders typically use 4-hour to daily charts for more reliable, longer-term momentum readings. The key is matching the timeframe to your holding period and ensuring you have enough historical data for accurate calculations.
How do I avoid false signals from the stochastic oscillator?
To minimize false signals, wait for confirmation before entering trades. Instead of acting immediately when the oscillator reaches overbought or oversold levels, wait for it to begin reversing direction and consider combining it with other indicators like moving averages or RSI. Also, avoid trading stochastic signals against strong trends, as the indicator can remain in extreme zones longer than expected.
What’s the difference between fast and slow stochastic oscillators?
The fast stochastic refers to the raw %K line calculation, which tends to be more volatile and generates more frequent signals. The slow stochastic incorporates smoothing through the %D line (a moving average of %K), producing fewer but more reliable signals. Most traders prefer the slow stochastic for its better signal-to-noise ratio, though scalpers sometimes use the fast version for quicker entries.
Can the stochastic oscillator be used alone for trading decisions?
While the stochastic oscillator is a powerful tool, using it alone increases the risk of false signals and whipsaws. Professional traders typically combine stochastic signals with trend analysis, support and resistance levels, and other technical indicators to create a more comprehensive trading system. This multi-layered approach significantly improves signal reliability and overall trading performance.
What are the best currency pairs to trade with stochastic oscillator signals?
The stochastic oscillator works well with all major currency pairs, but it tends to be most effective with pairs that exhibit clear trending or ranging behavior. EUR/USD, GBP/USD, and USD/JPY often provide excellent stochastic signals due to their liquidity and technical


