Tag Archives: binary options

How to create your own binary options trading strategy?

This is the prime question for every enthusiast. How do I create my own strategy? Well, each trader usually comes up with a unique trading strategy, but they all follow the same steps along the way. First, you’ll need a software to provide live data feed. There are many free softwares with MT4 being the most popular. Once you’ve installed your Mt4, then you can start the process.

First step, you’ll need to load onto the charts the various native indicators of platform, from trend indicators to the oscilators. If you are a novice, I know this will be confusing and overwhelming. Load each and every indicator on your chart and just watch them for a while.

What are we looking? We are looking for buy and sell opportunities. The tricky part is to learn how to read these indicators properly. To create a trading strategy, you’ll first need to understand that there are basically 3main kinds of strategies; the trend, reversal and a combination of both.

Market Sessions to trade binary options?


In Binary Options, timing is everything. It is important to know the trading sessions and the right time to trade. There are 3 major trading sessions; the Sydney, London and New York trading sessions. It starts with Sydney and ends with New York. For every trader, the best trading session will depend on their strategy, the overlay of London and New York trading session is the most volatile, and it is very risky for turbo expiries.

It is important to avoid trading an hour before and after the closing/opening of a trading session. Markets are usually very uncertain and irrational. This can be seen in the form of giant gaps and spikes.

Working on different Chart time frames?


When working with a charting software or web based data feed, it is important to know what timeframes are the best to work with. Depending on your trading strategy, different timeframes offers different results. For example, if you specialize on turbo trades, you’ll want to concentrate on 1 minute and 5 minute charts, anything higher will be defective to your strategy. Likewise, using 1minute chart for hourly expiries is also dangerous. You’ll need to find a balance between the timeframes and your desired expiries.

A good clue into knowing what chart timeframe will work best for you is by testing and comparing the results. This might be time consuming but it’s worth it. To make the process easier, you just need to be open minded and ready to accept the facts about your strategy and the best timeframe they seem to work on. All this, keeping in mind your targeted expiries.

Choosing the right currency pair?


In the financial markets, currency pairs tend to behave differently from one another. Some are highly volatile for example the GBP pairs and some generally slow and with low volume, like the NZD pairs. What currency pairs are the best in binary options trading? The answer is they are all great, depending on the strategy, you can make profit on any given pair in the markets. The most popular currency pairs are the EURUSD, GBPUSD , USDJPY and AUDUSD. These are the most traded pairs in binary options.

If your trading strategy is a reversal based strategy, slow moving pairs will be more profitable, and for trend following based strategy, volatile pairs will give you the best results.

How To Trade Binary Options


How To Trade Binary Options

To become a successful trader, it is important to know how to trade. This is a question every trader has asked, at one point in his/her career.

  • Learning the basics: It is important to become familiar with binary options trading terms. Some of this include; Call, Put, In the Money, Out of Money, Expiries etc. After mastering these terms, you’ll be able to navigate binary options platform and know exactly what you are looking for.
  • Picking a Data source: Each trader should have an external source of data and not rely solely on the one provided on the trading website. It could be online charts or other trading softwares like Ninja trader, e-charts or the most popular one, Meta trader.
  • The next thing to do is to find a strategy that gives a profitable win-loss ratio. This is the most important, having a strategy that works. For novice traders, you could use charting softwares to create strategies using inbuilt indicators like Moving averages, Stochastics, Bollinger bands etc. Once you have a strategy that has an edge, you are ready to start trading.
  • The following step is obvious, you’ll need to create and fund an account in order to start trading. You can check out this page to see some of our recommended brokers. Before funding an account, it is important to look at the platform and see if it meets your requirements. For example the minimum and maximum per trade, minimum per deposit, and also to do some research and find out if the site is reliable. All this matters when you want to invest your money in a binary options broker

What are binary options?

Binary option is a type of option in which the payoff can take only two possible outcomes, either some fixed monetary amount (or a precise predefined quantity or units of some asset) or nothing at all (in contrast to ordinary financial options that typically have a continuous spectrum of payoff). The two main types of binary options are the cash-or-nothing binary option and the asset-or-nothing binary option. The cash-or-nothing binary option pays some fixed amount of cash if the option expires in-the-money while the asset-or-nothing pays the value of the underlying security.

In Binary Options, you only need to predict either with a “Call” or “Put”. Binary Option trading has only two investment possibilities, either you win or you lose. After you select an asset, you will then predict whether you think that asset will go up or down in price. After the chosen expiry closes, if your prediction was correct, you will usually earn up to 85% on your original investments. If your prediction was wrong, you’ll lose all the money invested. Some Binary Options brokers usually refund 3% when your prediction was wrong, but this is not so common anymore.
Choosing an asset is the first step of your investment. Most Binary Options brokers offer a wide variety of tradable assets, from indicies to stocks, currencies and commodities. After choosing the asset, you’ll then choose an expiry in which you’ll predict if your chosen asset will appreciate or depreciate in value. After this step, you’ll then determine how much you want to invest. It is advisable to only trade or riskabout 5% of your account. This will help minimizes loses if they occur.

To trade binary options, you need to create an account with a binary options broker. You can create a Real account or a Demo account. After this step, you will need a profitable nd consistent strategy. This is the most important part. You need to be able to make proper market analysis in order to place and make profitable trades with Binary Options. Trading strategies determine your success in the markets. From Price action, to Fibonacci, Gann, Pivots, Custom indicators etc, you’ll need to find a profitable trading strategy and master it. Once this part is figured out, you can then trade without limits.

Backtesting your Binary Options Strategy

download (18)

Backtesting is the process of feeding historical data to your trading strategy to see how it would have performed. The hope is that its historical performance tells us what to expect for its future performance. The importance of this process is obvious if you have developed a binary options strategy from scratch, since you would certainly want to know how it has performed. But even if you read about a strategy from a publication, it is still imperative that you independently backtest the binary options strategy. There are several reasons for this.

Often, the profitability of a strategy depends sensitively on the details of implementation. Ideally, our backtesting program can be transformed into an automated execution program by the push of a button to ensure the exact implementation of details.

Once we have implemented every detail of a binary options strategy, in a backtest program, we can then put them under the microscope and look for pitfalls in the process or in the strategy itself. For example, in backtesting a binary options strategy based on technical indicators, on the Mt4 platform with both buy and sell positions, we have to take into account the different advantages of the different types of technical indicators involved, some will work well in trending markets and others in ranging markets.

More importantly, when backtesting binary options strategy ourselves, we often can find ways to refine and improve the strategy to make it more profitable or less risky. The backtesting process in binary options trading should follow the “scientific method.” We should start with a hypothesis about an arbitrage opportunity, maybe based on our own analysis of the markets. We then confirm or refute this hypothesis by a backtest. If the results of the backtest aren’t good enough, we can modify our hypothesis and repeat the process.


RSI Forex and Binary Options Strategy

2016-01-18-1453094884-1018249-Binary

Developed by. Welles Wilder, the Relative Strength Index calculates the difference in values between the closes over the Observation Period. These values are averaged, with an up average being calculated for periods with higher closes and a down- average being calculated for periods with lower closes. The up average is divided by the down average to create the Relative Strength. Finally, the Relative Strength is put into Relative Strength Index formula to produce an oscillator that fluctuates between 0 and 100.

By calculating the RSI in this way, Wilder was able to overcome two problems he had encountered with other momentum oscillators. Firstly, the RSI should avoid some of the erratic movements common to other momentum oscillators by smoothing the points used to calculate the oscillator. Secondly, the Y Axis scale for all instruments should be the same, 0 to 100. This would enable comparison between instruments and for objective levels to be used for overbought and oversold readings.

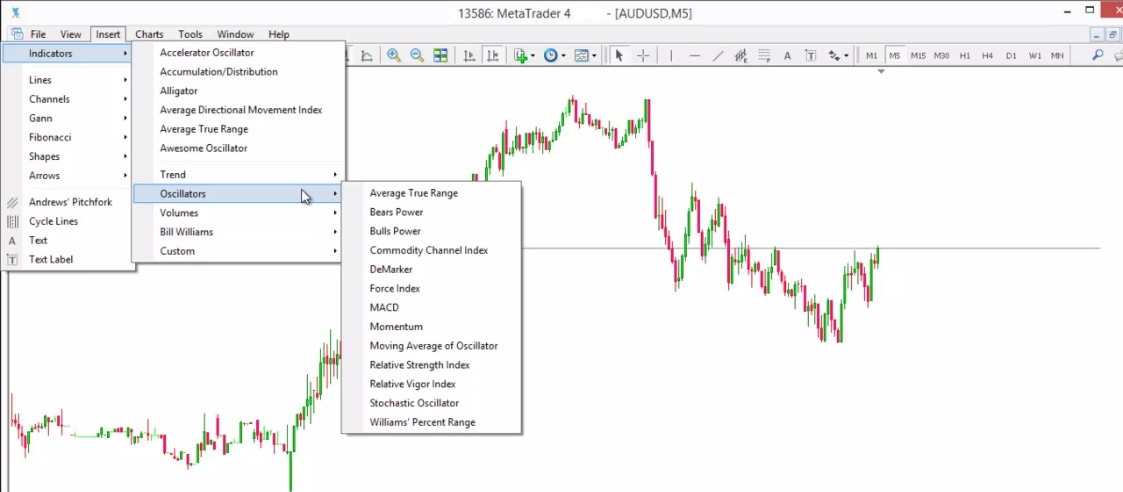
The most common uses of RSI in Binary Options trading are to:

  • Indicate overbought and oversold conditions

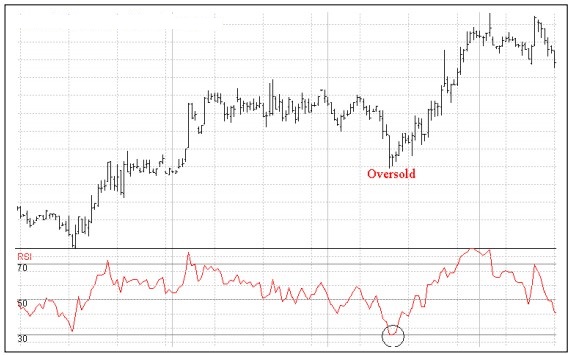
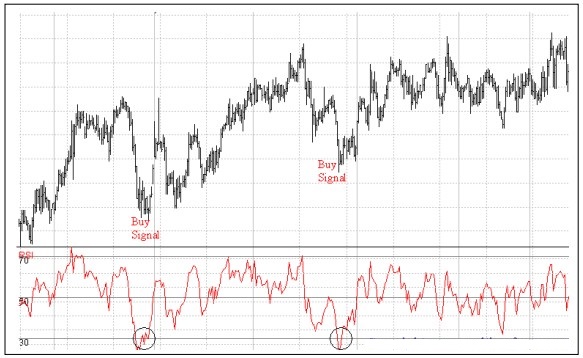
An overbought or oversold market is one where prices have risen or fallen too far and are therefore likely to retrace. If the RSI is above 70 then the market is considered to be overbought, and an RSI value below 30 indicates that the market is oversold. 80 and 20 can also be used to indicate overbought and oversold levels. Overbought and oversold signals re most reliable in a non-trending market where prices are making series of equal highs and lows.

rsi1

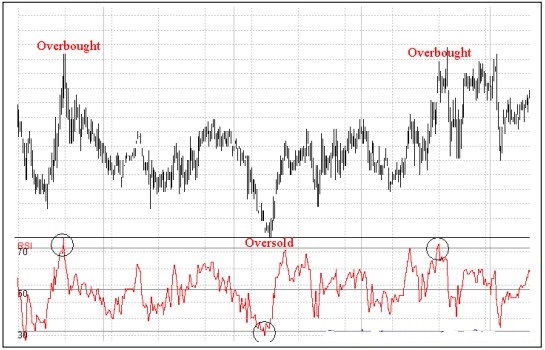
If the market is trending, then signals in the direction of the trend are likely to be more reliable. For example if prices are in an uptrend, a safer trade entry may be obtained by waiting for prices to pullback giving an oversold signal and then turn up again.

rsi2

  • Generate buy and sell signals.

If the RSI is above 70 and you are looking for the market to form a top, then the RSI crossing back below 70 can be used as a sell signal. The same is true for the market bottoms, buying after the RSI has moved back above 30. These signals are best used in non-trending markets.

rsi 3

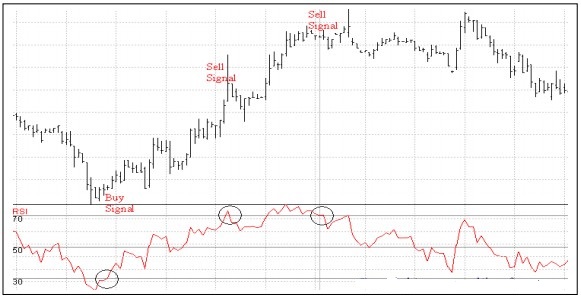
In trending markets, the most reliable signals will be in the direction of the trend. For example if the market is trending up, taking only buy signals after the RSI has moved back above 30 after dipping below it. The reason for taking signals only in the direction of the trend is that when the market is trending any counter trend signal is likely to indicate a small retracement against the underlying trend rather than true reversal.

rsi4

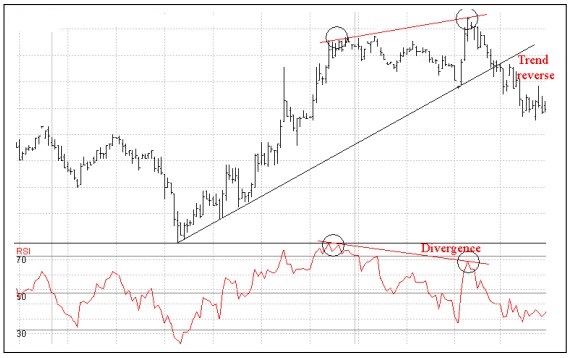
  • Indicate Bullish and Bearish Divergence

Divergence between the RSI and the price indicates that an up or down move is weakening. Bearish Divergence occurs when prices are making higher highs but the RSI is making lower highs. This is a sign that the up move is weakening. It is important to note that although Divergences indicate a weakening trend, they do not in themselves indicate that the trend has reversed. The confirmation or signal that the trend has reversed must come from price action, for example a trend line break.

rsi5

Parameters

Observation Period: (default 14)

Lower Bound percentage (default 30); this provides the lower boundary expressed as a percentage of the instrument’s value. The number must be less than the Upper Bound. Upper Bound percentage (default 70); this provides the upper boundary expressed as a percentage of the instrument’s value.

Wilder used 14 as an observation period although periods of 9 and 7 are also popular. Decreasing the observation period increases the sensitivity of the RSI to changes in price, resulting in a more responsive RSI. Note that a shorter observation period may also result in an increase in the number of false signals. A longer period results in a smoother RSI that will generate fewer signals.


Price Action System

With this strategy, we use support and resistance to predict the direction of price. This strategy uses new methods of synthesis in the financial markets, and it gives alerts in areas of pivots coupled with the speed of volume.

30 Minutes Strategy

For 30 minutes trades, you just need to sit and wait for a signal. The strategy for 30 minute trades is a simple and easy one to follow. It is a very effective trend following indicator. You can use the Trade Filter, to follow the trend.