
The volume indicator stands as one of the most underutilized yet powerful tools in forex trading, offering insights that price action alone cannot provide. While many traders focus solely on candlestick patterns and trend lines, those who understand volume analysis gain a significant edge in reading market sentiment and predicting price movements. In the decentralized world of forex trading, mastering volume indicators can transform your ability to time entries, exits, and identify high-probability trading opportunities.
Why Volume Matters in Forex Trading
Volume represents the lifeblood of market movements, serving as the engine that drives price action in every financial market. In forex trading, volume analysis helps you understand the strength behind price movements, distinguish between genuine breakouts and false signals, and identify when major players are accumulating or distributing positions.
Think of volume as the crowd behind a political rally. A candidate speaking to a packed stadium carries more influence than one addressing an empty auditorium. Similarly, price movements accompanied by high volume carry more significance and sustainability than those occurring on light volume. This principle becomes particularly crucial in forex markets where understanding institutional participation can mean the difference between profitable trades and costly mistakes.
The challenge for forex traders lies in the decentralized nature of currency markets. Unlike stock exchanges that provide precise volume data, forex operates through an interbank network where no single entity tracks total trading volume. This limitation led to the development of tick volume analysis, which serves as a reliable proxy for measuring market activity and trader interest in currency pairs.
How Volume Works in Decentralized Forex Markets
Understanding volume in forex requires grasping the fundamental difference between centralized and decentralized markets. Stock exchanges like the NYSE provide exact volume figures because all trades flow through a central clearinghouse. Forex markets, however, operate through a network of banks, brokers, and financial institutions worldwide, making it impossible to capture total trading volume across all participants.
This is where tick volume becomes invaluable for currency traders. Tick volume measures the number of price changes or transactions that occur within a specific time period, serving as an effective proxy for actual trading volume. When market activity increases, more transactions occur, resulting in higher tick volume readings. Conversely, during quiet market periods, fewer price changes occur, reflected in lower tick volume.
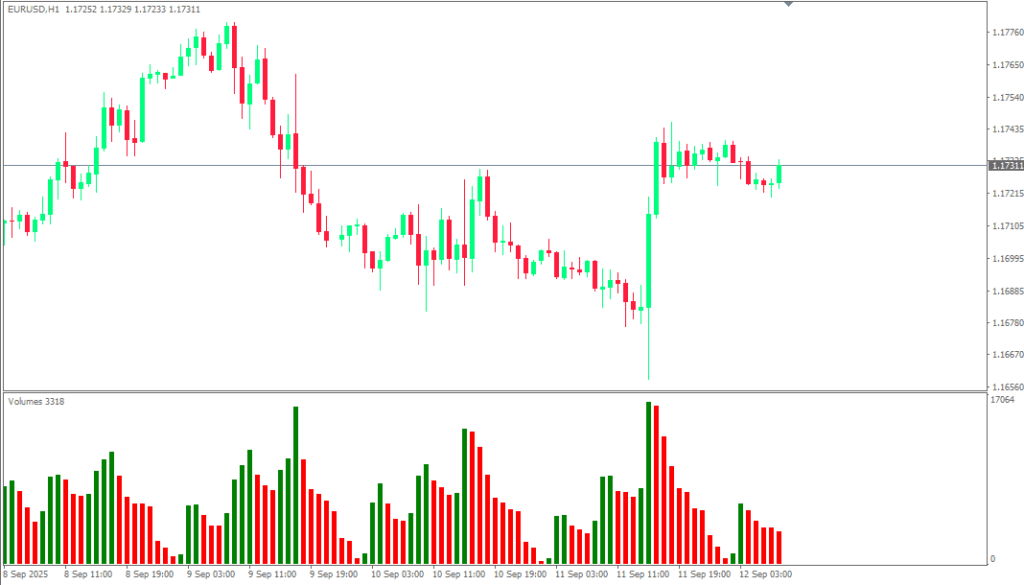
The relationship between tick volume and market activity proves remarkably consistent across different trading sessions. During the London session overlap with New York, for example, EUR/USD typically experiences its highest tick volume readings as both European and American traders participate actively. This correlation allows forex traders to use tick volume analysis effectively, even without access to true volume data.
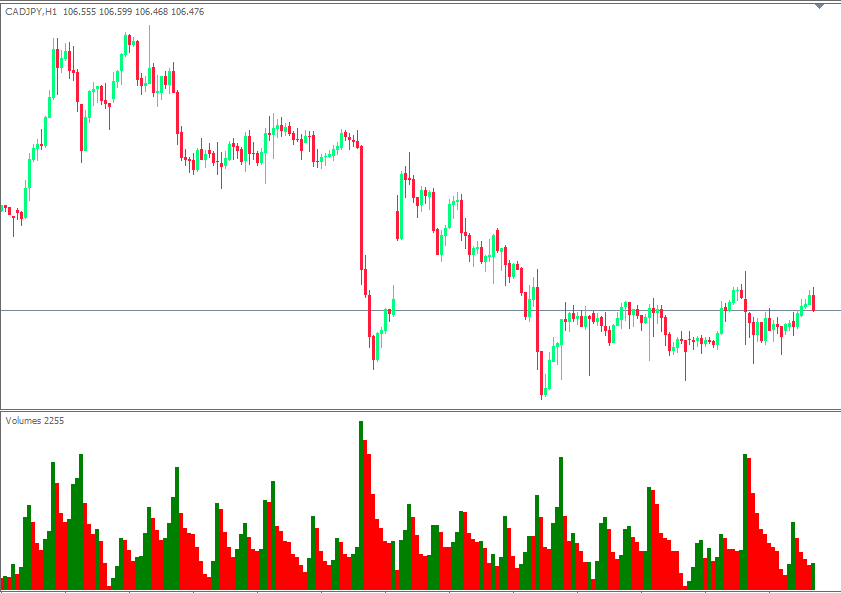
Major forex trading sessions demonstrate distinct volume patterns that savvy traders incorporate into their analysis. The Asian session often shows lower tick volume except for JPY pairs, while the London session brings increased activity across all major pairs. Understanding these patterns helps traders anticipate when volume-based signals carry the most significance and reliability.
Essential Volume Indicators Every Forex Trader Should Know
Several volume indicators have proven particularly effective for forex analysis, each offering unique insights into market dynamics and trader behavior. The On Balance Volume (OBV) indicator stands out as a powerful tool for identifying accumulation and distribution phases in currency pairs. OBV adds volume on up days and subtracts it on down days, creating a cumulative line that reveals the underlying flow of money into or out of a currency pair.
The Volume Weighted Average Price (VWAP) provides another essential perspective, calculating the average price weighted by volume throughout the trading session. Institutional traders often use VWAP as a benchmark for execution quality, making it valuable for retail traders to understand where the smart money considers fair value. When price trades above VWAP, it suggests bullish sentiment, while trading below VWAP indicates bearish pressure.
The Accumulation/Distribution Line takes a different approach, focusing on the relationship between closing prices and the trading range. This indicator helps identify whether volume is flowing into buying or selling pressure, particularly useful during consolidation periods when price action appears indecisive but underlying accumulation or distribution is occurring.
The Money Flow Index (MFI) combines price and volume data to create an oscillator that identifies overbought and oversold conditions. Often called the “volume RSI,” MFI provides more reliable signals than price-only oscillators because it incorporates the volume component that validates the strength of price movements.
How to Interpret Volume Indicator Signals
Reading volume indicator signals requires understanding the relationship between price action and volume patterns. High volume accompanying price breakouts typically indicates institutional participation and increases the probability of sustained moves. When EUR/USD breaks above a key resistance level on increasing volume, it suggests that large players are driving the move and that the breakout has a higher probability of continuation.
Volume divergence patterns offer some of the most powerful trading signals available to forex traders. Bullish divergence occurs when price makes lower lows while volume indicators make higher lows, suggesting that selling pressure is diminishing despite continued price declines. This pattern often precedes significant reversals as it indicates that the underlying selling momentum is weakening.
Bearish divergence presents the opposite scenario, with price making higher highs while volume indicators decline. This pattern suggests that buying pressure is exhausting itself despite continued price advances, often leading to trend reversals or significant corrections. Recognizing these divergence patterns early can provide exceptional entry opportunities with favorable risk-reward ratios.
Volume spikes during news events require careful interpretation, as they often represent emotional reactions rather than sustainable trend changes. While increased volume during major economic announcements is normal, the key lies in observing whether the elevated volume continues after the initial spike. Sustained high volume following news events often indicates that the market has found a new equilibrium, while quickly diminishing volume suggests that the move was temporary.
Volume behavior during consolidation phases provides valuable insights into future price direction. Declining volume during sideways price action often indicates that a significant move is building, as fewer participants are willing to trade at current levels. When volume begins expanding while price remains range-bound, it typically signals that a breakout is imminent.
Proven Volume-Based Trading Strategies
The volume breakout strategy represents one of the most reliable applications of volume analysis in forex trading. This approach focuses on identifying breakouts from consolidation patterns that occur with significantly higher than average volume. The key lies in waiting for both price and volume confirmation before entering trades, dramatically improving the success rate of breakout trades.
Implementation requires establishing baseline volume levels for your chosen currency pairs and timeframes. When price breaks above resistance or below support with volume exceeding 150-200% of the recent average, it provides strong confirmation that the breakout has institutional backing. Entry occurs on the breakout candle close, with stops placed just inside the broken level to protect against false signals.
Volume divergence trading offers another powerful strategy, particularly effective for swing traders and those seeking counter-trend opportunities. This approach involves identifying divergences between price action and volume indicators, then waiting for price confirmation before entering trades. The strategy works exceptionally well at major support and resistance levels where divergences often culminate in significant reversals.
Volume profile analysis takes a more advanced approach, examining the distribution of volume at different price levels to identify areas of high trader interest. This technique helps identify value areas where institutional traders are most active, providing excellent support and resistance levels for trading decisions. While more complex than traditional volume indicators, volume profile analysis offers sophisticated insights into market structure and participant behavior.
Volume Indicator Pitfalls to Avoid
Many forex traders fall into the trap of applying stock market volume analysis principles directly to currency trading without considering the unique characteristics of decentralized markets. This approach often leads to misinterpretation of signals and poor trading decisions. Remember that tick volume in forex provides valuable insights but differs fundamentally from actual volume data available in centralized markets.
Over-relying on volume indicators alone represents another common mistake that can undermine trading performance. Volume analysis works best when combined with price action, technical levels, and market context. Using volume indicators as confirmation tools rather than standalone signal generators typically produces more consistent results and helps avoid false signals during choppy market conditions.
Misinterpreting news-driven volume spikes can lead to costly trading mistakes, particularly for inexperienced traders. High volume during major economic announcements often represents emotional reactions and algorithm-driven trading rather than sustained institutional positioning. Learning to distinguish between news-driven volume and organic trading volume helps avoid getting caught in temporary market volatility.
Incorrect timeframe selection for volume analysis can also compromise trading results. Volume patterns that appear significant on lower timeframes may prove meaningless when viewed in the context of higher timeframe trends. Aligning your volume analysis timeframe with your trading style and holding period ensures that the signals you’re interpreting remain relevant to your trading decisions.
Start Using Volume Analysis Today
The volume indicator provides forex traders with invaluable insights into market dynamics that price action alone cannot reveal. By understanding how tick volume works in decentralized markets and learning to interpret volume signals correctly, you gain a significant edge in timing trades and identifying high-probability opportunities.
Success with volume analysis comes from consistent practice and proper integration with your existing trading strategy. Start by adding volume indicators to your charts and observing how they interact with price movements across different market conditions. Focus on the major currency pairs initially, as they typically provide the most reliable volume data and clearest signals.
Remember that volume analysis excels as a confirmation tool rather than a standalone trading system. Combine volume signals with strong technical levels, trend analysis, and proper risk management to create a robust trading approach that can adapt to changing market conditions.
Begin implementing volume analysis in your demo trading account today, and observe how this powerful tool can enhance your market timing and improve your overall trading performance. What volume patterns have you noticed in your favorite currency pairs? Share your experiences and questions in the comments below, and don’t forget to subscribe to our newsletter for more advanced trading insights that can elevate your forex trading success.
Frequently Asked Questions
What is the difference between tick volume and real volume in forex trading?
Tick volume measures the number of price changes or transactions within a specific time period, serving as a proxy for actual trading volume in forex markets. Real volume represents the actual number of shares or contracts traded, which isn’t available in decentralized forex markets. Tick volume correlates strongly with market activity and provides reliable insights for currency traders, making it an effective substitute for traditional volume analysis.
Which volume indicator works best for forex day trading?
For forex day trading, the Volume Weighted Average Price (VWAP) and tick volume histograms tend to be most effective. VWAP helps identify intraday fair value levels and institutional interest, while tick volume histograms show real-time market activity. The Money Flow Index (MFI) also works well for day traders seeking overbought/oversold signals with volume confirmation on shorter timeframes.
How do I interpret low volume in forex markets?
Low volume in forex typically indicates reduced market participation and potential consolidation phases. During low volume periods, price movements often lack conviction and are more susceptible to reversals. However, low volume during consolidation can also signal that a significant breakout is building. The key is observing volume changes relative to recent averages rather than absolute volume levels.
Can volume analysis help predict forex market reversals?
Yes, volume analysis can be highly effective for predicting market reversals through divergence patterns. When price makes new highs or lows but volume indicators fail to confirm with corresponding highs or lows, it often signals weakening momentum and potential reversals. Additionally, climax volume at trend extremes frequently marks reversal points, though confirmation from price action is essential.
What are the best timeframes for volume analysis in forex trading?
The optimal timeframes for volume analysis depend on your trading style. Scalpers might use 1-5 minute charts, day traders typically focus on 15-minute to 1-hour timeframes, while swing traders prefer 4-hour to daily charts. Higher timeframes generally provide more reliable volume signals, but the key is matching your volume analysis timeframe to your trade duration and ensuring sufficient data for meaningful patterns.