Developed by John Bollinger, Bollinger Bands are charted by calculating a simple moving average of price, then creating two bands a specified number of standard deviations above and below the moving average. You can draw the simple moving average analysis on the same chart as the Bollinger bands analysis, using the same interval. In addition, Bollinger bands are usually plotted with a bar analysis so that the proximity of the bands to the prices can be easily observed.
The most common uses of Bollinger bands in binary options strategies includes to:
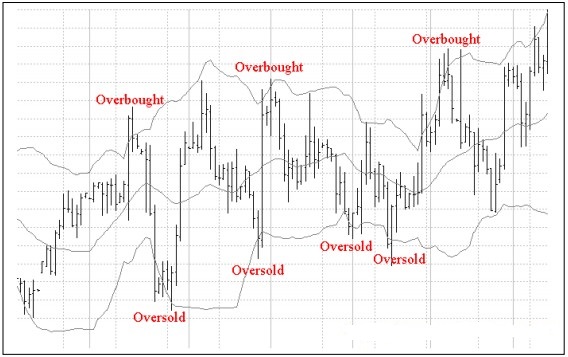
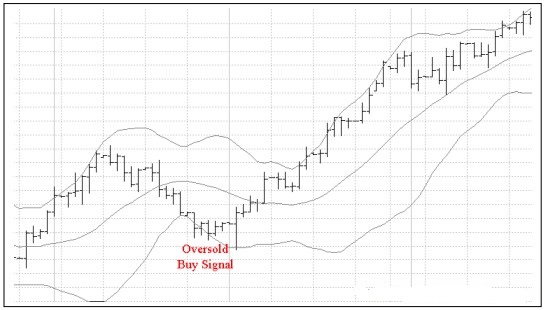
-Identify overbought and oversold markets
An overbought or oversold markets is one where the prices have risen or fallen too far and are therefore likely to retrace. Prices new the lower band signals an oversold market and prices near the upper band signal an overbought market. Overbought and oversold signals are the most reliable in a non-trending market where prices are making a series of equal highs and lows.
If the market is trending, then signals in the direction of the trend are likely to be more reliable. For example if prices are in an uptrend, a safer trade entry may be obtained by waiting for prices to pullback giving an oversold signal and then turn up again.
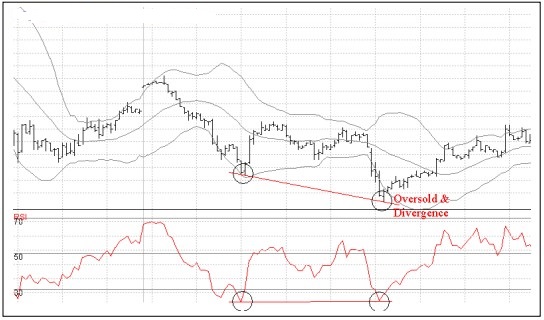
–Used in combination with an oscillator, to generate buy or sell signals
If you use Bollinger Bands in combination with an oscillator such as Relative Strength Index (RSI), buy and sell signals are generated when the Bollinger Bands signal an overbought/oversold market at the same time the oscillator signals a divergence.
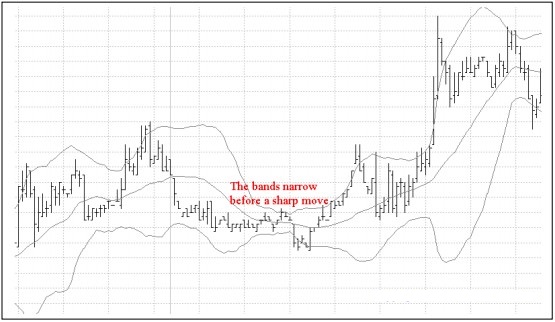
- Warn of an impending price move
The bands often narrow just before a sharp price move. A period of low volatility often precedes a sharp move in prices; low volatility will cause the bands to narrow.
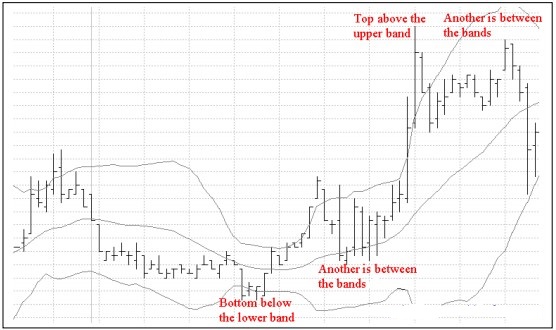
- Signal potential tops and bottoms
A top that breaks above the upper band followed by another that is between the bands signals a potential top in the market. A bottom that breaks below the lower band followed by another that is between the bands signals a potential bottom.
The Parameters
The length of the moving average is usually 20 days or less. Bollinger suggested using a moving average that would catch the first retracement of an up move. Bollinger used a figure of 2 standard deviations in his work, which was in stock trading. A value of 2 captures about 95% of the variation in price action. Different figures may be more appropriate for other types of markets.