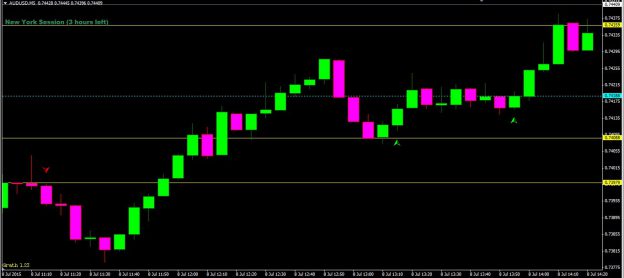
This article provides insight into the two major methods of analysis used to forecast the behavior of the financial markets. Technical analysis and fundamental analysis differ greatly, but both can be useful forecast tools for binary options traders. They have the same goal – to predict a price or movement. The technician studies the effect while the fundamentalist studies the cause of market movement. Many successful binary options traders combine a mixture of both approaches for superior results.
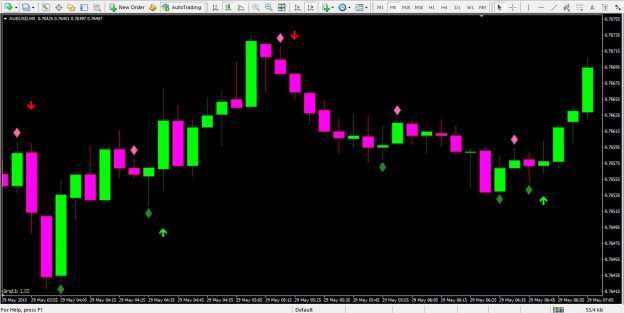
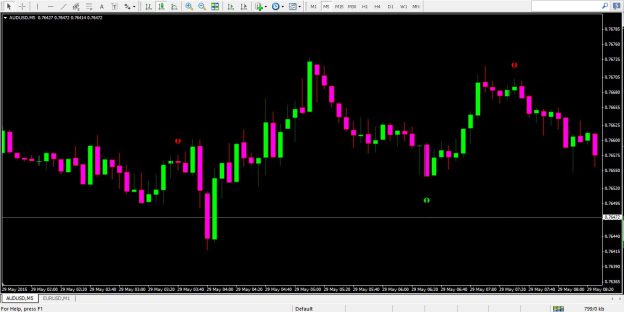
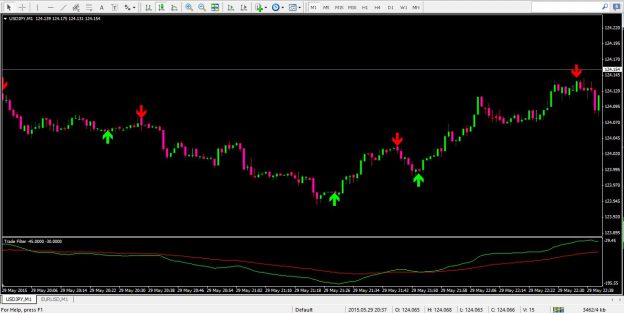
Technical Analysis Technical analysis is a method of predicting price movements and future market trends by studying charts of past market action. Technical analysis is concerned with what has actually happened in the market, rather than what should happen and takes into account the price of instruments and the volume of trading, and creates charts from that data to use as the primary tool. One major advantage of technical analysis is that experienced analysts can follow many markets and market instruments simultaneously. Technical analysis is built on three essential principles:

1. Market action discounts everything! This means that the actual price is a reflection of everything that is known to the market that could affect it, for example, supply and demand, political factors and market sentiment. However, the pure technical analyst is only concerned with price movements, not with the reasons for any changes.
2. Prices move in trends: Technical analysis is used to identify patterns of market behavior that have long been recognized as significant. For many given patterns there is a high probability that they will produce the expected results. Also, there are recognized patterns that repeat themselves on a consistent basis.
3. History repeats itself: Forex chart patterns have been recognized and categorized for over 100 years and the manner in which many patterns are repeated leads to the conclusion that human psychology changes little over time. Forex charts are based on market action involving price. There are five categories in Forex technical analysis theory:
• Indicators (oscillators, e.g.: Relative Strength Index (RSI)
• Number theory (Fibonacci numbers, Gann numbers)
• Waves (Elliott wave theory)
• Gaps (high-low, open-closing)
• Trends (following moving average).


